GstarCAD 2025 User Guide
GstarCAD 2025 User Guide
Contents
- #GstarCAD 2025 Introduction and Installation
- #Starting up GstarCAD 2025
- #The User Interface
- #Customize the Drawing Environment
- #Customize User Interface
- #Import, Export and Migrate User Custom Settings
- #Tool Palettes
- #Design Center
- #Clean Screen
- #Lock UI
- #Create, Open, Save, Recover a Drawing and Manage Drawings
- #Control the Drawing Views
- #Precision Tools and the Properties of Drawings
- #Specify Units, Angles and Scale
- #Drawing Limits
- #Grid and Grid Snap
- #Use Object Snaps
- #Use Polar Tracking and Object Snap Tracking
- #Use Orthogonal (Ortho Mode)
- #Working with Linetypes
- #Working with Layers
- #Create and Name Layers
- #Setting the Current Layer
- #Removing Layers
- #Controlling Layer Visibility
- #Locking and Unlocking Layers
- #Controlling Layer Printing
- #Setting a Layer's Print Style
- #Freeze or Thaw Layers
- #Setting the Layer Color
- #Setting a Layer's Linetype
- #Setting a Layer's Lineweight
- #Filter List of Layers
- #LAYULKALL
- #Dislaying Lineweights
- #Spell Command
- #Hardware Acceleration
- #Create Objects
- #Draw Linear Objects
- #Draw Curved Objects
- #Create 3D Objects
- #3D Thickness and Elevation
- #3D Faces
- #Ruled Surfaces
- #Tabulated Surface
- #Revolved Surface
- #Solid Box
- #Solid Cone
- #Solid Cylinder
- #Sphere
- #Torus
- #Pyramid
- #Wedge
- #Solids Extrude
- #Solids Revolve
- #Solid
- #Flatshot
- #Creating Composite Solids
- #POLYSOLID
- #PLANESURF
- #SURFOFFSET
- #CONVTOMESH
- #CONVTOSOLID
- #CONVTOSURFACE
- #CONVTONURBS
- #Point Cloud
- #Create Regions
- #Create Revision Cloud
- #Create Break Line
- #Create Wipeout
- #Create Table
- #Modify Objects
- #Remove Objects
- #Copy Objects
- #Mirror Objects
- #Offset an Object
- #Create an Array of Objects
- #Move Objects
- #Rotate Objects
- #Align Objects
- #Scale Objects
- #Lengthen Objects
- #Stretch Objects
- #Trim Objects
- #Extend Objects
- #Create Breaks
- #Create Chamfers
- #Create Fillets
- #Disassociate Compound Objects
- #Modify Polylines
- #Modify Multilines
- #Clip
- #Add selected
- #Multiple
- #Set by layer
- #MKSHAPE Command
- #Notes and Labels
- #Dimensions and Tolerances
- #Create Dimensions
- #Horizontal and Vertical Dimensions
- #Create Aligned Dimensions
- #Create Baseline and Continued Dimensions
- #Create Rotated Dimensions
- #Create Angular Dimensions
- #Create Radial Dimensions
- #Jogged Dimension
- #Create Diameter Dimensions
- #Create Ordinate Dimensions
- #Create Quick Dimension
- #Create Arc Length Dimension
- #DIMREASSOCIATE
- #Use Dimension Styles
- #Dimension Styles
- #Modify Dimension Lines
- #Modify Extension Lines
- #Choose Dimension Arrowheads
- #Fit Dimension Text within Extension Lines
- #Fit Diameter Dimension Text
- #Align Dimension Text
- #Position Dimension Text Vertically
- #Position Dimension Text Horizontally
- #Dimension Units
- #Alternate Units
- #Display Lateral Tolerances
- #Set the Scale for Dimensions
- #Modify Existing Dimensions
- #Add Geometric Tolerances
- #Create Dimensions
- #Blocks, Attribute and reference
- #Create and Insert Blocks
- #Create Blocks
- #Create Nested Blocks
- #Create Drawing Files for Use as Blocks
- #Change the Base Point of Drawings to Be Used as Blocks
- #Update Changes in the Original Drawing
- #Use Paper Space Objects in Blocks
- #Insert Blocks
- #Modify a Block Definition
- #Remove Block Definitions
- #Define and Use Block Attributes
- #Modify Block Attributes
- #Extract Block Attribute Data
- #Synchronize Attributes
- #Reference Other Drawing Files (Xrefs)
- #DGN Underlay
- #DWF Underlay
- #PDF Underlay
- #About Clipping Underlays
- #Edit Reference Tab
- #PDF Import and Export
- #Create and Insert Blocks
- #Hatches and Raster Images
- #Layout, Plot and Publish Drawings
- #Create Multiple-View Drawing Layouts
- #Overview of Layout
- #Work with Model Space and Paper Space
- #Specify Layout Settings
- #Select a Paper Size for a Layout
- #Determine the Drawing Orientation of a Layout
- #Adjust the Plot Offset of a Layout
- #Set the Plot Area of a Layout
- #Set the Plot and Lineweight Scale for a Layout
- #Move and Copy Layouts
- #Create Layout from Template
- #Create and Modify Layout Viewports
- #Plot Drawings
- #Create Multiple-View Drawing Layouts
- #Create and Edit Dynamic Blocks
- #Dynamic Block Editor
- #Dynamic Blocks Creation Samples
- #Base Point Parameter
- #Visibility
- #Alignment
- #Point Movement
- #Linear Movement
- #Number of Grips
- #Angle Offset
- #Linear Stretch
- #Parameter Value Set
- #Symmetrical Stretch
- #Distance Multiplier
- #Chain Action
- #Scale Action
- #Scale Character
- #Rotation
- #Polar Stretch
- #Polar Stretch Action Characteristics
- #Array
- #Parametric Constraints
- #Share Date between Applications
- #Security
- #BIM Support
- #Innovative Features
- #Collaboration

GstarCAD 2025 Introduction and Installation
GstarCAD 2025 Introduction
GstarCAD 2025 elevates performance to a new level with Hardware Acceleration and other improvements on a series of features, significantly enhances the design experience. Exciting new features, including Parametric Constraints, BIM Data Editing, and Voice Annotation, etc., further enrich functionality. What’s more, compatibility has been expanded with the addition of Python support, empowering more robust customization and automation. Without further ado, let's explore these exciting updates!
System Requirement
Before installing GstarCAD, please confirm whether the specifications of your PC meet the following requirements:
- OS (Operating System)
Windows 11
Windows 10 version 1507 or higher: Home, Professional, Education, and Enterprise (LTSC and Windows 10 S are not supported)
Windows 8.1 (with Update 2919355): Core, Professional, and Enterprise
Windows 7 SP1 (with latest Windows Updates): Home Premium, Professional, Enterprise, Ultimate
Windows Server 2016: Standard and Datacenter
Windows Server 2019: Standard and Datacenter
Windows Server 2022: Essentials, Standard, Datacenter
Because GstarCAD and related tools are developed and compiled with visual studio 2017, in order to ensure the normal operation of the software, the operating system needs to be able to install the environment package of visual studio 2017 normally.
- CPU
1.6 GHz processor (2 GHz or faster Multi-core processor recommended)
- RAM
2GB (8GB recommended or higher)
- Graphics Card
1 GB GPU (2 GB GPU recommended or higher)
- Hard Disk
The system and installation disk need more than 1 GB of space. (10 GB recommended or higher)
To improve performance, it is recommended that the software be installed and stored on a solid state drive (SSD).
- Display Resolution
1024*800 or above; GstarCAD will work best at a resolution of HD and 4K resolution.
- Additional Requirement
Administrator rights are required to install GstarCAD and license tools.
.NET Framework 4.8 or above (Only for custom software development).
The network license server and all workstations running applications that rely on network licenses must support the TCP/IP protocol.
GstarCAD 2025 Installation
Users can visit www.gstarcad.net to download GstarCAD 2025 to your computer or server.
GstarCAD 2025 Install Wizard will guide the user to install the software in the operating system completely and successfully.
Please follow the steps below to install GstarCAD 2025:
- Double-click the executable file downloaded and the GstarCAD Install Wizard dialog box will pop up.


Click Browse button and choose the destination path where setup will install the files.

- Click GstarCAD Install Wizard > Options, users can select or deselect the VBA feature according to your need. You can also read the System Requirements and Activation Mode of GstarCAD.

- Read the License Agreement and Privacy Policy, and check Agree to Gstarsoft License Agreement and Privacy Policy.

- Click Install button to continue the installation.

- You just need to wait for a few minutes for the Overall Progress.

- Then you will see the workspace selection window. Select your favorite workspace and click the Next button.

- Click Finish button to exit the wizard. The GstarCAD wizard has successfully installed GstarCAD 2025.

Starting up GstarCAD 2025
The User Interface
1

You can enjoy working at GstarCAD 2025 environment in different ways. You can display and rearrange elements like the toolbars, display the command bar, switch between workspaces, change the interface themes and enable the status bar. The toolbars and command bar can also be floated anywhere on the screen or docked as well.

5324
12
13
7
8
11106
Quick Access Toolbar
Display the frequently used tools like: New, Open, Save, Undo, Redo, Save As, Plot, Plot Preview and Help. Moreover you can customize it (adding more commands from the drop-down button) or showing it bellow/above the ribbon.


Workspace
Workspace Switching
Switch between workspaces (2D Drafting and GstarCAD Classic). What' more, GstarCAD 2025 provides many color themes, such as GstarCAD, Lightblue, Blue, Black, Sliver and Aqua, you can choose your favorite color theme directly.


Workspace Command
The WORKSPACE command allows you to create, modify and save workspaces current. You can customize GstarCAD ribbon or classic workspace to suit interface environment needs much easier.
Workspaces are sets of menus, toolbars, palettes, and ribbon control panels that are grouped and organized so that you can work in a custom, task-oriented drawing environment. When you use a workspace, only the menus, toolbars, and palettes that are relevant to a task are displayed. In addition, a workspace may automatically display the ribbon, a special palette with task-specific control panels. You can easily switch between workspaces. The following task-based workspaces are already defined in GstarCAD: 2D Drafting and GstarCAD Classic.


If you execute WORKSPACE command, the following prompts are displayed:
Set Current: Sets a current workspace.
Save As: Saves a current interface configuration as a workspace.
Edit: Opens the Customize User Interface dialog box, Customize tab, where you can make modifications to a workspace.


Rename: Renames a workspace.
Delete: Deletes a workspace.
Settings: Opens the Workspace Settings dialog box, which controls the display, menu order, and Save settings of a workspace.
Menu Bar
The menu bar is used for selecting commands by mouse instead of inputting commands by keyboard. In it you can find the follow menu tabs: File, Edit, View, Insert, Format, Tools, Draw, Text, Dimension, Modify, Window, Application, Help, Express and Collaboration.

Menus and Shortcut Menus

You can use any of the option on the Menus from the menu bar at the top of the drawing area. Choose one of the following methods to use a menu:- On the menu bar, click a menu name to choose the menu or to expand a list of options.- Press Alt and the key for the underlined letter in the menu name to open the corresponding menu item list, and then choose menu items from it. For example, to edit the drawing file, press <Alt+E> to open the Edit menu.


Shortcut menus provide quick access to specific commands. A shortcut menu displays when you right click an object, status bar, the Model tab name, or a Layout tab name. The selections presented in the shortcut menu depend on what you clicked.
Shortcuts Customize


A faster way to invoke a command is customize its shortcut. The CUSTACC command allows you to customize, delete or modify existing command shortcuts. To access this command go through the menu bar, under tools, select customize and choose Shortcuts Customize. After that, the shortcut customize window will pop up. As you can see, there is a list of shortcuts command that you can easily modify, delete or even make a new one over an existing one.

If you want to create a new one, just click the New button and the customize command window will pop up. Then you can search the command or select one from the command list. For example, you can input “command line” and then select the requested command. Notice that it will display the command properties by selecting the requested command at the right side of the window. After selecting the command, press OK.

Then the set shortcut window will pop up. You can input the desire keyword(s). For example, you can set the shortcuts SHIFT+D. If you want to delete a created shortcut command, invoke the command CUSTACC and then select the delete button from the Shortcut Customize window.
The Ribbon
The ribbon consists of several panels, which are organized into each tab according to their task label. The tools and controls in each panel are also available in toolbars and dialog boxes.

Panel Tab Expandable panel Expandable tools button

Tab: The ribbon is structure by tabs. Every tab displays a series of panels with its own tools (commands or thumbnails) easier to select or pick.

Panel: The panel shows the most used tools. Some thumbnails has an expandable tools button that can be expanded in a drop-down method. In addition, most of panels at home tab have an expandable panel that shows up more commands related.

Expandable Panel: The expandable panel is located at the bottom of the panel. If you click at the bottom of the panel, more commands related will be displayed.

Expandable Tools Button: Some thumbnails (tools or commands at the panel) have an expandable tools button that can be expanded in a drop-down method. If you click this button, all the related tools will be displayed.
Appearance
You can manage the interface’s theme plus show/display toolbars, menu bar, file tabs and status bar.


Drawing Area

Your drawings are displayed in the drawing window.
Toolbars

Toolbars partially contain buttons that start commands. When you move your mouse or pointing device over a toolbar button, the tooltip displays the name of the button.


The Standard toolbar at the top of the drawing area contains commonly used commands such as Copy Pan and Zoom, as well as Microsoft Office standard commands such as New, Open, and Save. GstarCAD 2025 classic workspace initially displays several toolbars by default:
-
Draw toolbar
-
Draw order toolbar
-
Modify toolbar
-
Properties toolbar
-
Layer toolbar
-
Style toolbar
-
Standard toolbar
Displaying and Hiding Toolbars
GstarCAD 2025 provides many toolbars, which you can show or hide in both classic and ribbon interfaces. You can also move and dock toolbars. To choose which toolbars to display:
1.- Execute TOOLBAR command or select the option TOOLBARS from the drop-down list under Appearance button (at top right of the interface) to open the Toolbar dialog box.

2.- Choose the toolbars you want to hide or display by checking/unchecking the small boxes in the dialog box, then click OK.


To make floated a horizontal docked toolbar, just click and hold the left side of it and drag around the place you need.

To make floated a vertical docked toolbar, just click and hold the top of it and drag around. To dock any toolbar, just double-click at the left side of it.
Starting Commands Using Toolbars

To start a command from a toolbar, click a command button and respond to the prompts.
User Coordinate System (UCS)

The icon indicates the orientation of the drawing in two dimensional space.
Model Space and Layout Space tabs
Click a tab to switch between the drawing of your model and a printed layout.


Command Window
The command bar is a dockable window in which you can type commands and view prompts and other program messages. You can move the command bar by dragging it.

When the command bar is floating, you can drag the top or bottom of the window to change the number of lines of text it displays. You can dock the command bar at the top or bottom of the drawing.
Enter Commands on the Command Line

Enter Commands on the Command Line
Type the full command on the command line and press ENTER or SPACEBAR, or right-click on your pointing device to start the command. Some commands also have abbreviated names (aliases).
Specify Command Options

Once you have entered a command on the command line, it displays a set of options or a dialog box. To choose a different option, enter one of the options in the brackets (either uppercase or lowercase letter is OK), and then press ENTER or SPACEBA.
Execute, Repeat and Cancel Commands
To execute commands, press SPACEBAR or ENTER, or right-click your pointing device when the command names has been entered or responsive to prompts. If you want to repeat a command that you have just used, press ENTER or SPACEBAR. To cancel a command in progress, press ESC.
Nesting a Command

To use a command inside an active command, type an apostrophe before you type the command. For example, you turn on the object snap while you are drawing a circle, thus you can setup Object snap mode before continuing drawing.

Command: circle>Specify center point for circle or [3P/2P/Ttr (tan tan radius)]: 'osnap
(Setup object snap mode as Center in Draft Settings dialog, and then close the dialog to go on performing CIRCLE command)
Enter System Variables on the Command Line

System variables are available for controlling how certain commands work. For example, GRIDMODE is used to control the grid status ON or OFF.
Using GstarCAD Text Window

Using GstarCAD Text Window
The GstarCAD Text Window displays a history of the commands and prompts issued since you started the current session of GstarCAD.
To display or close the GstarCAD Text Window press F2.
To view entries in the GstarCAD Text Window, just drag the scroll bars or use the Up (↑) and Down (↓) arrows to display previously used commands.
Switch Dialog Boxes and Command Line
If you enter LINETYPE on the command line, the Linetype Manager dialog box will pop up. Entering -LINETYPE on the command line displays the equivalent command line options. The system variables below affect the display of dialog boxes as well:
-ATTDIA controls whether INSERT uses a dialog box for attribute value entry. -EXPERT controls whether certain warning dialog boxes are displayed. -FILEDIA controls the display of dialog boxes used with commands that read and write files. For example, if FILEDIA is set to 1, OPEN displays the Open Drawing As dialog box. If FILEDIA is set to 0, OPEN displays prompts on the command line. Even when you set FILEDIA to 0, you can get a file dialog box displayed through entering a tilde (~) at the first prompt.
Dynamic Input

Dynamic Input
"Dynamic input" box is a floating window which appears near the cross cursor. It provides a convenient method for users to input commands or system variables dynamically and display the index information. Type a command using the dynamic input, it displays a list of all the commands whose prefix matches what you've typed plus it will displays all their icons making easier to recognize them at glance. When creating and editing objects, the dynamic dimension can guide you draw precisely. What's more, the dynamic input displays all options of a command and could select them in different methods.
GstarCAD 2025 supports the functions of Dimension Input, vertical Dynamic Prompts list and independent Pointer Input boxes, it provides easier-to-use experience and improves design efficiency.
- Independent Pointer Input Boxes
Pointer Input boxes for length, angle and coordinates, etc. are displayed independently, making it more convenient for users to input different values by simply switching between the boxes using the TAB key.


- Dynamic Dimension Input
When creating and editing objects, data such as length, angle, radius, etc., are displayed in the form of dimensions, which are dynamically changing as the mouse cursor is being moved. With the help of the independent Pointer Input boxes, users are now able to input dimension data and execute design operations more efficiently.

- Vertical Dynamic Prompts List
Dynamic Prompts List are now displayed vertically by default in GstarCAD 2025, which allows users to see all the prompts at once, it simplifies drawing operations. Horizontal prompts list could still be activated by using system variable DYNLISTSTYLE.

Status Bar

Display information such as the current cursor coordinates, Snap, Grid, Ortho, Polar, Osnap, Otrack and other settings. In addition to displaying information, the status bar is a quick way to access many features. You can click status bar items to make changes, and right click items to display short cut menus that allow you more choices. By default, the status bar is shown as the picture below:

The status bar icon also can be show as text button, right click on one of the icon of the status bar, uncheck the "Use Icon" option and you will get another method to show the status bar.

Properties Palette

You can modify the value or properties of object(s) you wanted in each column. The Properties palette shows all properties of the specified object. When selecting multiple objects, the Properties palette shows the command properties of the selected objects. If none of the object is selected, the Properties palette displays the general properties of the current layer, View properties as well as the UCS information. By default, double-click an object opens Properties palette if the Properties palette is hidden. This operation is not available when the objects are block, hatch pattern, text, multiline, external reference or gradient fill.

GstarCAD also supports Quick Properties, which is a set of objects properties displayed through the Properties Palette. You can customize your own Quick Properties; you can decide to show your preferred object type with selected object properties to save the limited drawing space. You can set the objects properties to display in quick properties from CUI.
Palette Settings:
You can click the Properties button or right-click on the Title bar of the palette or window to enable Anchor left/right, Auto-hide (There is an Auto-hide button in the Title bar) or adjust the transparency of the floating palettes or windows.


Anchor Left<: Anchors a dockable window or palette to the left of the drawing area. When the cursor is moved on it, the anchored palette or window displays with full opaque, when the cursor is moved away, it hides automatically. Also, when an anchored window is open, its content overlaps the drawing area.
Anchor Right>: Anchors a dockable window or palette to the right of the drawing area. When the cursor is moved on it, the anchored palette or window displays with full opaque, when the cursor is moved away, it hides automatically. Also, when an anchored window is open, its content overlaps the drawing area.

Auto-hide: A floating window rolls open and closes as the cursor moves across it. When this option is unchecked, the window stays open.
Transparency: Adjusts the level of transparency for the window and on mouse over.
-
How transparent should the palette be: Sets the transparency of a palette while the cursor moves away from the palette. It’s also controlled by the GLOBALOPACITY system variable.
-
How transparent should the palette be on mouse-over: Sets the transparency of a palette while the cursor moves on the palette. It’s also controlled by the ROLLOVEROPACITY system variable.
-
Click to Preview button: Press the button, it displays the transparency of palette while the cursor moves away from the palette, release the button, it displays the transparency of a palette while the cursor moves on the palette.
-
Apply these settings to all palettes: Applies transparency settings to all palettes. It’s also controlled by the APPLYGLOBALOPACITIES system variable.
-
Disable all window transparency(global): Controls whether palettes can be adjusted transparency. It’s also controlled by the PALETTEOPAQUE system variable.
NAVICUBE
The NaviCube is a navigation tool that is displayed when you are working in 2D model space or 3D visual style, which allows switching between standard and isometric views easier. It consists of a cube, compass and options, is draggable and clickable, and supports switching to any available preset views, rolling the current view, or setting the current view as the Home view.
You can enter the NAVICUBE command, or click Ribbon

View
3D Tool
NaviCube to control whether to display the NaviCube in the drawing area. When the value is ON, the NaviCube is displayed, when the value is OFF, the NaviCube disappears.


Appearance of the NaviCube: The NaviCube is displayed in one of two states: inactive and active. When your cursor is not touching the NaviCube, it’s inactive, it appears partially transparent by default so that it does not obscure the view of the model. When you move the cursor over it, it becomes active, it is opaque, so the view of the objects in the current view of the model may be obscured. And you can other properties of the NaviCube within the Settings option.


Cube: It is in the top right corners of the drawing area over the model, and shows the current viewpoint of the model. When moving the cursor over it, you are able to click the faces, corners or edges to change the views conveniently, as well as click on the cube and drag it to roll the current view.


Compass: The compass is displayed below the NaviCube and indicates the north direction defined for the model. You can click any of the directional letters on the compass to rotate the model.
When the view is “Front“ “Back” ”Left” or ”Right”, some little triangle buttons will display around the cube, which allow you to switch between adjacent views by clicking them.
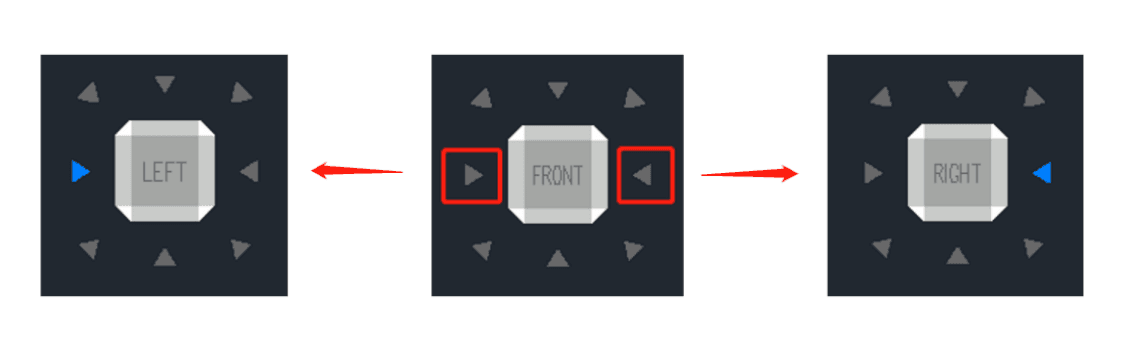
When clicking the triangle button at the right or left side, the view is switched to its right or left adjacent view. So, you can continuously switch between different views and rotate the navigation cube horizontally by clicking these two buttons.
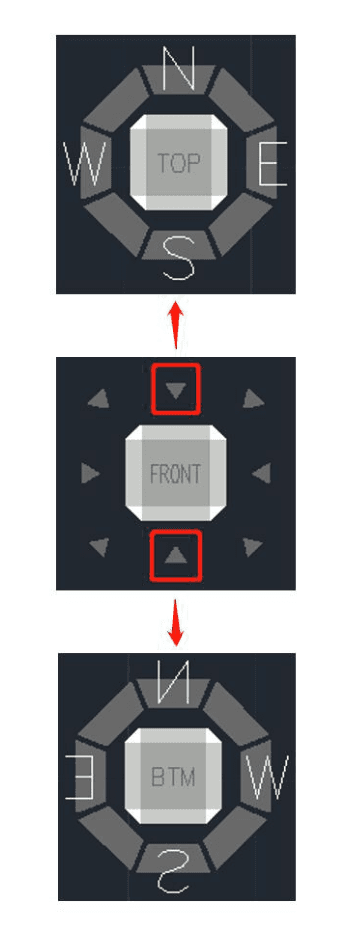
When clicking the triangle button at the top or bottom side, the view is switched to top or bottom view. The top and bottom triangle buttons can only be clicked once.
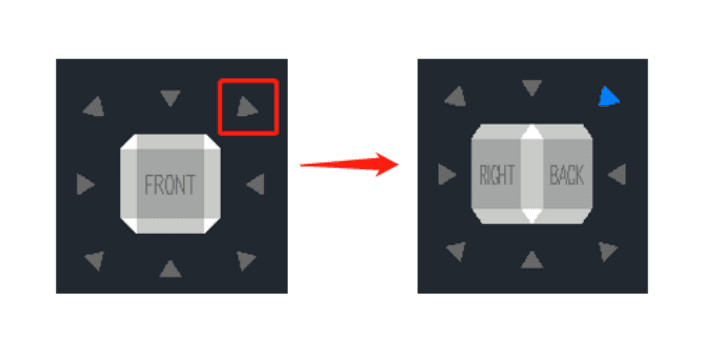
When clicking the triangle button at corners, the view is switched to the edge view of two adjacent views. The corner triangle buttons can only be clicked once.
Options Menu:
-
Home: Changes to Home view
-
NaviCube Settings: Opens NaviCube Setting window
-
On-screen: Identifies the in the viewport where the NaviCube is displayed.
-
Navicube size: Specifies the size of the NaviCube.
-
Inactive Opacity: Controls the opacity of the NaviCube when inactive.
-
Show UCS Menu: Controls the display of the UCS drop-down menu.
-
Zooms to extents after view change: Specifies if the model is forced to fit the current viewport after a view change.
-
Orient Navicube to current UCS: Controls whether the NaviCube reflects the current USC or WCS.
-
Show compass below the Navicube: Controls the whether the compass is displayed below the NaviCube tool.
-
Restore Default: Restore NaviCube settings to default values.
-
3D views: Displays view control list.
-
Coordinated system: Controls coordinate system.
-
Upside down: Changes to the view side which is parallel to the current view side.
-
90°Clockwise: Rotates 90 degrees clockwise.
-
90°Counter Clockwise: Rotates 90 degrees counterclockwise.
Right-click Menu:
-
Home: Goes back to Home view
-

Set Current View as Home: Specifies the current view as the Home view.
-
NaviCube Settings: Opens the NaviCube Setting window.
-
Help: Open Online Help system, Home – Commands – N – NAVICUBE command.
Lasso Selection
The Lasso selection allows you to create an irregularly shaped window or crossing selection set. The implementation of lasso selection can not only replace frame selection to select simple objects, but also solve the problem of difficult selection of some complex objects using frame selection.
To use the lasso selection, just hold the mouse button down while dragging the mouse to create the lasso. When you release the mouse button, the lasso is completed.
Lasso Selection Modes
Lasso selection provides three modes: Window Lasso, Crossing lasso and Fence lasso, you can press the spacebar to cycle through the lasso modes.
- Window Lasso Selection: Hold the mouse button down and drag the mouse from left to right, only the objects that are completely enclosed in the selection area are selected.


- Crossing lasso selection: Hold the mouse button down and drag the mouse from right to left, the objects enclosed in and that are crossed by the selection area are selected.


- Fence Lasso Selection: Specify points to define a fence, the objects that pass through the fence will be selected.


System Variable Compatibility
GstarCAD optimizes the PICKAUTO system variable to be consistent with ACAD.
| System Variable | Description | Value | Value Description |
|---|---|---|---|
| PICKAUTO | Used in conjunction with lasso selection to control the automatic windowing for object selection. This system variable is also used to control the opening and closing of the lasso. | -7 ~ -1 | Selects an object by clicking. It only stores the value and the value will not take effect. |
| 0 | Selects an object by clicking. Turns off automatic window and crossing selection. | ||
| 1 | Starts a window or crossing selection if the cursor is not directly over an object when clicking; Selects an object directly by clicking if the cursor is on the object, selection complete. | ||
| 2 | Starts a window or crossing selection even if the cursor is directly over an object. | ||
| 4 | Starts a window or crossing lasso selection if the cursor is not directly over an object when clicking; Selects an object directly by clicking and dragging if the cursor is on the object, selection complete. |
To specify more than one option, enter the sum of their values. For example, entering 5 specifies the bitcode 1 and 4 options.
| Value | Description |
|---|---|
| 3 | The combination of bitcode 1 and bitcode 2 which has the same effect as bitcode 2 |
| 5 | The combination of bitcode 1 and bitcode 4 which has the same effect as bitcode 4 |
| 6 | The combination of bitcode 2 and bitcode 4 |
| 7 | The combination of bitcode 1, 2 and 3 which has the same effect as bitcode 6 |
Summary:
-
When the value of PICKAUTO is 0, the objects can be selected only by clicking.
-
When the value is 1, 2 or 3, it’s window selection.
-
When the value is 4, 5, 6 or 7, it’s the window selection and crossing lasso selection (To specify a window selection area, click and release the left mouse button, move the cursor, and click again to finish; To create a lasso selection, click, drag, then release the left mouse button to finish).
Customize the Drawing Environment
In GstarCAD 2025, there are different elements of the working environment that can be customized to fit your needs.
Set Interface Options

In the Options dialog box, you can change many of the settings that affect the interface and drawing environment.
Settings of Modifying Interface
Automatic Save (Open and Save tab): Save your drawing at specified time intervals. To use this option, in the Options dialog box, Open and Save tab, select Automatic Save and enter the interval in minutes.

Color (Display tab): Specify the background colors used in the layout and Model tabs and the color used for prompts and crosshair. Font (Display tab): Change the fonts used in the window and in the text window. This setting does not affect the text in your drawings.

Search Path (Files tab): Set the search path to find drawing support files such as text fonts, drawings, linetypes, and hatch patterns.

Save and Restore Profiles
Creating profiles for different users or projects and sharing profiles by importing and exporting profile files are enabled. By default, your current options are stored in a profile named Default. The current profile name, as well as the current drawing name, is displayed in the Options dialog box.
GstarCAD 2025 stores the profile information in the system registry and saves it as a text file (an ARG file) and also organizes essential data and maintains changes in the registry as required. If you make changes to your current profile during a session and you want to save those changes in the ARG file, you must export the profile. When you export the profile with the current profile name, GstarCAD updates the ARG file with the new settings. You can re-import the profile to update your profile setting


MOVEBAK Command
The new MOVEBAK command changes the destination folder for drawing backup (BAK) files. Once you specify a path, the drawing’s BAK files is placed in that path after every save operation.
Enter new value for MOVEBAK, or for none <current setting>:
Enter a . (Period) for none or type the folder name
If you enter ".", the MOVEBAK folder name is cleared and new BAK files will be created in the original folder.
Customize User Interface
Drag & Drop Customization: An innovative way to customize user interface must be easy and quickly according to user needs, so this is possible by drag and drop action, that means users can drag any command from the command list and drop it into workspaces elements like ribbon panels and toolbars that are visible at top right corner of the CUI dialog box. Users will not have restrictions to place anywhere or even arrange a preferred command on a panel or toolbar. UI customization has never been easier and flexible through Drag & Drop action.

Brief introduction of CUI dialog box:
- CUI dialog box: Now the CUI dialog box is divided into three tabs: Elements Customization, Workspace Customization and Transfer tab in which the main attraction is the Elements Customization tab through its new way of customization (Drag & Drop).

- Right click menu: Context menu is available for different interface element as shown below:


- Find command: There are several methods to quickly find out the command you want, with these methods, you never need to browse the command from the top of the list until the end which greatly enhance your work efficiency.


1- Filter the command by Category: Click the button right side and select the category the command belongs which will reduce the command search scope
2-Filter a command by entry relevant keywords: For example, input “dimension” in the filter, all the commands contains the word “dimension” will be shown, reducing the number of commands to browse.

3- Command cleaner: If you input the keywords in the filter, the icon

will automatically change to

which is used to clean the content in the filter, meanwhile, the following command list will return to the default state.
4- Find and replace: In Find tab input the command you want to find out and click Find Next, the command you searched will be positioned accurately. In replace tab, you can replace one command with another command, but we suggest not change the standard command name and description.

5- Create a new command: If it is necessary to add secondary development program command to the command list, you can set the items follow the current command settings as shown below.


Restore and reset:
If all the customization operation has been finished, but you made some mistakes when customizing CUI or you are not satisfied with the effect, restore and reset can help you recover to the original settings.
Restore:Restore the backup Settings, click "Apply" button, the data before modifying will be saved as backup files which are used for recovery.
Reset:Recover to the initial setting when first installing GstarCAD.
Import, Export and Migrate User Custom Settings

GstarCAD 2025 supports importing and exporting the settings of current version, as well as importing settings of old version, which enable users to avoid repeating same settings when they install the software. Users can also import Tool Palettes from AutoCAD.
Import and Export Settings of Current Version
You can import and export of settings of current version in the WINDOWS Start menu without starting GstarCAD, which makes the operation more convenient and simpler. And, importing the saved exported settings when the software is reinstalled or Installed on other machines will save plenty of time.

Export Settings of current version: Open windows start menu, find your Gstarsoft item and click “Export the settings of current version”, choose the location you prefer to save the “.cfgbak” file and save it.

Import Settings of current version: Open windows start menu, find your Gstarsoft item and click “Import the settings of current version”, find the “.cfgbak” file and open it.

Exported Settings includes:
-
Options: File locations, Display options, User preferences, Drafting settings, Selection settings and other custom settings
-
Customize User Interface: Workspace, toolbars, ribbon customization, command, keyboard and mouse button customizations
-
Alias file (gacd.pgp)
-
Printer support file
-
Hatch pattern (*.pat)
-
Tool Palettes
-
Template file (*.dwt)
-
Fonts and shapes (*.shx)
-
Line type (*.lin)
-
Font mapping file (gacd.fmp)
Reset Settings to Default

In GstarCAD 2025, you are able to reset GstarCAD settings to default by clicking Windows Start menu
GstarCAD 2025
Reset Settings to Default.

You can only reset the settings when the software is closed.
If the software is closed, the Reset Settings dialog box will pop up, you can select ‘Back up and reset custom settings’ option to create a backup file that contains your customized files before resetting the product. Or, you can select ‘Reset custom settings’ option to reset the product without creating backup files of your custom settings.

- Resetting the custom settings actually is cleaning up the registry information of GstarCAD software and deleting the Local folder and Roaming folder. After starting GstarCAD again, the new Local and Roaming folder will be regenerated.
- Backing up and resetting the custom settings actually is cleaning up the registry information of GstarCAD software and backing up the Local folder and Roaming folder under C:\Users\username\AppData, and then deleting the Local folder and Roaming folder. After starting GstarCAD again, the new Local and Roaming folder will be regenerated.
Migrate from a Previous Release
GstarCAD 2025 adds a "Migrate from a previous release" feature in the WINDOWS Start menu program items, which allows users to migrate selected settings of old versions directly to the new version after installation without copying and setup manually under same language. The earliest version that can be migrated is GstarCAD 2016.

Migrated Settings includes:
-
Options: File locations, Display options, User preferences, Drafting settings, Selection settings and other custom settings
-
Customize User Interface: Workspace, toolbars, ribbon customization, command, keyboard and mouse button customizations
-
Alias file (gacd.pgp)
-
Printer support file
-
Hatch pattern (*.pat)
-
Tool Palettes
-
Template file (*.dwt)
-
Fonts and shapes (*.shx)
-
Line type (*.lin)
-
Font mapping file (gacd.fmp)
- After migration from older version, the relevant settings of current version will be overwritten, and can’t be restored.
- After migration from older version, the new functionalities that only current version supports, will be reset to default.
Import AutoCAD Tool Palettes
You can import AutoCAD customized Tool palettes in the WINDOWS Start menu easily. If you installed AutoCAD in your PC, you can just import the file from the path in AutoCAD options. If you need to import AutoCAD customized Tool Palettes from another equipment, the path can be anywhere, but the folder must include AcTpCatalog.atc file.

Before importing an AutoCAD tool palettes, read carefully the following notes:
-
The default blocks of AutoCAD cannot be directly imported into GstarCAD. If you want to import default blocks of AutoCAD to GstarCAD, you need to drag them to the drawing from the Tool Palettes, and add them back to Tool Palettes in AutoCAD, then save the drawing and import.
-
The imported file is only block and command, hatch pattern, light source, constraint, table and other objects haven’t been supported yet.
-
If there is a lack of grip point in the imported dynamic block, probably it’s the result of the imperfect action of the dynamic block.
-
All eligible GstarCAD paths will be detected first when you import the file into GstarCAD directly, the entire Tool Palettes in GstarCAD will be overwritten.
-
The order of the tools list in Tool Palettes after import may be different from that of AutoCAD. The reason is that AutoCAD supports a file recording the order of the tools in Tool Palettes, but GstarCAD does not.
-
If the source DWG drawing location is changed before you import custom AutoCAD Tool Palettes and its tools, the block(s) imported into the palettes in GstarCAD will be unable to be used without that corresponding DWG drawing original saved path.
Tool Palettes

Tool Palettes
Tool palettes are tabbed areas within the Tool Palettes window. The items you add to a tool palette are called tools. You can create a tool by dragging an object onto the tool palette. In GstarCAD, blocks and external references (xrefs) can be dragged onto the tool palette. The new tool inserted will has the same properties into your drawing. Also you can close,create, customize the paletts by doing right click on it. To open the tool palettes just press CTRL+3 or Type TOOLPALETTES command.


Design Center

With Design Center, you can organize access to drawings, blocks, text styles and other drawing contents:
-Browse for drawing content on your computer or a networked drive. -View definition tables for named objects and then insert, attach, copy and paste the definitions into the current drawing. -Create shortcuts to drawings and folders that you access frequently. -Add content such as xrefs, blocks to a drawing. -Drag drawings, blocks to a tool palette for convenient access
Folders Tab: The following icons are displayed in this tab: networks and computers, computer drives, folders, drawings and related support files, Xrefs, layouts and named objects, including blocks, layers, linetypes, text styles and dimension styles within a drawing.
Open Drawings: A list of currently opened drawings is displayed. If you click a drawing file and then click one of the definition tables, you can load the content into the content area. History: A list of previously opened files is displayed. If you double-click a drawing file from the list, you can load the content into the content area.
Favorites: If you have contents need to access quickly on a regular basis, the Design Center provides a solution to finding those. When you select any type of content, you can right-click and choose to add it to Favorites. In favorite folder you can save shortcuts to content on local drives, a network drives. The original file or folder doesn't move; but all shortcuts you create are stored in the Favorites folder.
Clean Screen
Now, if users want to maximize drawing space, they can press the keywords Ctrl+0 or select the icon (Clean Screen) located in the right corner of the status bar. After executing this command, Toolbars and dockable windows (excluding the main menu bar, command line and status bar)will automatically be cleaned. This function can provides better visibility as large as possible to make it easier to fully understand every details of the drawing.

Lock UI
Lock UI locks the position and size of toolbars and dockable windows such as Design Center, Properties palette, etc. To unlock them temporarily, hold down CTRL key. LockUI setting is stored as a bit code using the sun of the following values:
0 Toolbars and windows not locked
1 Docked toolbars locked
2 Docked or anchored windows locked
4 Floating toolbars locked
8 Floating windows locked
Create, Open, Save, Recover a Drawing and Manage Drawings
Create a Drawing
Create a New Drawing Using Default Settings

When the system variables FILEDIA and STARTUP are set to 1, typing NEW at the command bar, it opens Startup dialog box, from which you can use Default Setting, Template or Wizard to create a new drawing.
You can select either imperial or metric units for the new drawing.
Imperial measurement system: The drawing uses internal default values with default boundary is 12 × 9 inches.

Metric measurement system: The drawing uses internal default values with default boundary is 429 × 297 millimeters.
Create a New Drawing Using a Setup Wizard
From the Startup dialog box, you can select "Use a Wizard" tab to create a new drawing by the wizard. There are two wizard options illuminated as follows:
Advanced Setup Wizard:


From this option, you can set units of measurement, precision of displayed units, and grid limits. Also specify angle settings such as units of measurement style, precision, direction, and orientation based on template gcadiso.dwt.


Quick Setup Wizard: From this option, you can specify units of measurement, precision of displayed units, and grid limits based on template gcadiso.dwt.
Create a New Drawing Using Template

When you need to create several drawings with the default settings, you can save time by creating a template file designed to create the same drawing files so that you does not need to specify default settings each time you start. Conventions and settings commonly stored in template files include: unit type and precision, title blocks, borders, and logos, layer names, snap, grid, and ortho settings, grid limits, dimension styles, text styles and Linetypes.
Also when the system variables FILEDIA and STARTUP are set to 1 and 0 separately, typing NEW opens Select Template dialog box, from which you can select the desired one or use the default template by clicking the arrowhead button next to the Open button.
Open a Drawing

Open a Drawing
Open a Drawing (2)
You can open drawing (.dwg) files, Drawing Exchange Format (.dxf) files, drawing standard (dws) files and drawing template (.dwt) files. You can also open and check drawings that you suspect are damaged.

To open an existing drawing: File > Open Command line> OPEN Using shortcut> CTRL+O
-In the dialog box, choose the type of file you want to open.
-Choose the folder containing the desired file.-Choose the drawing you want to open, and then click the Open button or Double click on the drawing you want to open.
Multiple Open Drawings
You can open multiple drawings at one time. There are several methods for switching a drawing to another.
- Acting the drawing by clicking it or using shortcut keys of <Ctrl+Tab>. - You can change the display styles to Cascade, Title Vertically or Title Horizontally from the Window menu. You can also use Arrange Icons to align icons if there are several minimum drawings.

Save a Drawing
Save a Drawing (2)
You save drawing files for later use. You can also set up automatic saving and backup files and save only selected objects. In addition, you can also save a drawing in a Drawing Exchange Format (.dxf) file or a drawing template (.dwt) file. If you created your drawing using a template, saving the drawing does not alter the original template.

To save a drawing: File > Save Command line>SAVE Using shortcut> CTRL+S

Remark: When you save a drawing the first time, the program displays the Save Drawing As dialog box so that you can choose a directory and type a name for the drawing.
Save Your Drawing Automatically
You can specify to save drawing files automatically in order to minimize the lost data once a problem occurs.
If you start the automatic save option, your drawing is saved at specified time intervals. By default, system assigned the name filename. sv$ for temporarily saved files, filename here refers to current drawing name.

Save Part of a Drawing File
You can use BLOCK command or WBLOCK command to create a new drawing from part of an existing drawing. You can select entities or a block definition in your current drawing and save them in a new drawing file. The description also can be saved in the new drawing.
Save to a Different Type of Drawing File

Choose the format from Save as Type in the Save Drawing As dialog box, you can save a drawing to an earlier version of the drawing format (DWG) or drawing interchange format (DXF), or save a drawing as a template file.
To save a different format:
File > Save As Command line> SAVE AS Using shortcut> SHIFT+CTRL+S
DWG Convert
DWGCONVERT command converts one or a bunch of selected drawing files to another dwg version available. The newly generated file can overwrite the original one, and it can also be compressed into a self-extracting EXE file or a ZIP file to facilitate batch format conversion of the entire project drawing.

Batch conversion between graphical file formats

Converts one or a bunch of selected drawing files to an older or current dwg version available. The newly generated file can overwrite the original file, and it can also be compressed into a self-extracting EXE file or a ZIP file to facilitate batch format conversion of the entire project drawing.
Steps to Convert DWG files to different format
-
Click “File”>“DWG Convert” in turn
-
Click “DWG Convert” dialog box >“Add File” (Near the bottom)
-
In “Select File” dialog box, you need to browse to the folder where the graphics file is to be converted.
-
Click the graphic file name, and then click “Open”.
-
In “DWG Convert” dialog box, click “Conversion Setups”. In “DWG Convert” dialog box, create a new Conversion Setup (NEW), modify existing Conversion Setup (MODIFY) or select a previous Conversion Setup, and then click “CLOSE”.
-
In “DWG Convert” dialog box, click “CONVERT”.
-
If the Conversion Setups specify an EXE or ZIP file, browse to the desired destination folder, then double-click the file to select it. If needed, input a new name for the file.
-
Click “SAVE”.
Use Backup Files

Use Backup Files
GstarCAD creates a backup file with the current drawing name and a ".bak" extension to save the previous version of the current drawing when launching "backup automatically" option.
Reduce the Time Required to Save a Drawing File

In order to reduce the time of saving a drawing file, you can specify the incremental save percentage on the Open and Save tab of Options dialog box or from the ISAVEPERCENT system variable.
The incremental save updates only the portions of the saved drawing file you changed. Drawing files will contain a percentage of potentially wasted space when you use incremental saves. This percentage increases after each incremental save until it reaches the specified maximum value, and then a full save is perform.
Recover a Drawing
Recover a Damaged File
You can recover some or all of data by reverting to a backup file or using commands to find and correct errors if a drawing file is damaged. A drawing file may be damaged by a hardware failure, power outage and system crash. You had better create a backup file if the drawing is important.
In the Open and Save tab of Options dialog box, you can specify the backup file are created when you save drawings and set the proper interval time for saving. Then a backup copy file with a ".bak" extension is created when you save the named drawing once again. After that, a backup file is always updated while you executing the command SAVE or SAVEAS.

You can use RECOVER command to check and attempt to open a damage file. Then uses AUDIT command to find and correct errors.
To open a damaged file: File > Drawing Utilities> Recover

Command line>RECOVER
-In the dialog box at Files of Type, choose the type of file you want to recover. -Choose the directory containing the damaged file. -Choose the damaged file you want to recover and Click the Open button or Double click on the drawing you want to open.
To check errors for a drawing file: File > Drawing Utilities> Audit Command line> Audit

-
To choose from the opened drawing, click on File > Drawing Utilities > Audit
-
Input Y or N to determine whether to recover the errors that are automatically found by GstarCAD, and then press Enter.
Drawing Recovery Manager

Once terminated by hardware problems, power failure or software problems, the application is capable of backup the opened drawing file. At the next startup, the program starts "Drawing Recovery Manager" in which all of the auto-backup drawing files that have been closed accidentally will be displayed. You can open the file of your demand by double clicking at the Backup File list on the "Drawing Recovery", if there is any damage to the file, system attempts to recover the drawing in process of backup.
When program or system stopped by accident, the drawing files need to recover are sorted into the following types.
-Recovered drawing file saved when program fails (DWG) -Temporary saved file (sv$) -Backup file (BAK) -Source drawing file (DWG)
Manage Drawings

Manage Drawings
In GstarCAD the Sheet Set Manager allows you to manage the entire project drawing sheetsets. It can manage all the work flow from sheets creation, printing and publishing.etc.
In Sheet Set Manager, a sheet set is an organized collection of sheets from several drawing files and each sheet in a sheet set is a layout in a drawing file.
Begin taking advantage of sheet set functionality for your current projects with minimal effort by importing your current drawing layouts into a sheet set. You can easily open drawings from a central location while you continue edit them using traditional tools.
Sheet Set Control
Lists menu options to create a new sheet set, open an existing sheet set, or switch between open sheet sets.


Tree View: Displays the contents of the sheet list.
Details or Preview: Displays either descriptive information or a thumbnail preview of the currently selected item in the tree view.

You can use the following actions in the tree view:
-
Right-click to access shortcut menus of the operations that are relevant to the currently selected item.
-
Double-click items to open them. This is a convenient method for opening drawing files from the Sheet List. You can also double-click items in the tree view to expand or collapse them.

- Click one or more items to select them for operations such as opening, publishing, or transmitting.

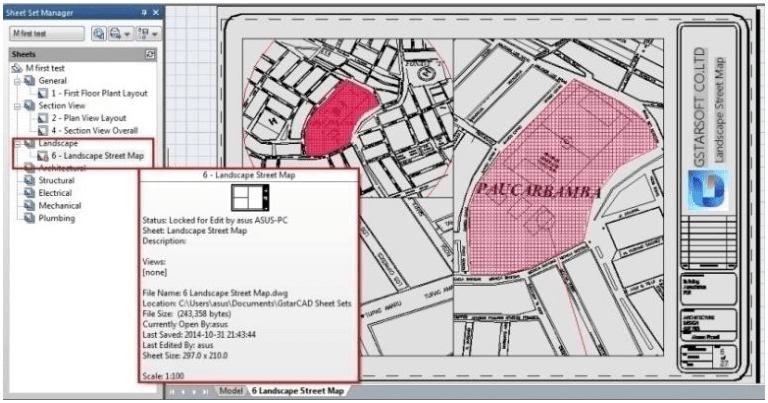
Move the cursor over a single item to display descriptive information or a thumbnail preview of a selected sheet, view, or drawing file.
- Drag items within the tree view to reorder them.
Sheet Set Manager Basic Information
Opening Sheet Set Manager Ribbon: View tab > Palettes > Sheet Set Manager or Type: sheetset


Creating a Sheet Set
Once the Sheet Set Manager is open, select the pull down box at the top and then click on New Sheet Set.
A new dialog box will pop up displaying the 4 steps in creating a Sheet Set.
Begin

Under Begin there are two options for creating a sheet set. Option one
Is using “An example sheet set” that allows the use of a standard template to create the sheet set.
Option two
Is using Existing drawings to start a new sheet set. We are going to select the Existing Drawings option.
Sheet Set Details
This is where basic information like sheet set name, description, and file location can be added.


Choose Layouts
Existing layouts can be added to the sheet set by browsing for the proper file needed in the drawing set. Once the layouts are selected, click Next to confirm.

Confirm The confirm tab will give a summary of the layouts to be added to the set. After selecting the Next button the new layout will be added to the sheet set.

Import layouts to the Sheet Set Manager
To add a new sheet from an existing drawing layout, right click the title of the sheet set and select Import Layout as Sheet. A new pop up box will appear which allows you to browse for an existing drawing to add a layout.

Tip: If the import box is not checked, the layout is already in the sheet set or the layout is unable to be imported into the set.

Managing Sheet Set
Moving and Removing Sheets from a set
Once the sheets have been added to the Sheet Set Manger, they can be dragged and dropped to the order needed. To remove a sheet from the set, right click and select Remove Sheet.

Rename and Renumbering Sheets
To rename and renumber a sheet or a subset, right click on the sheet needed to be changed and select Rename & Renumber.
A pop up box will show up that will allow the number, sheet title and layout name to be changed.

Adding project information to a sheet set

To add project information to the sheet set, like project name, project number, and project description, right click on the sheet set title and scroll down to the sheet set Properties. A new pop up box will display that allows the update of project information. Tips: Project information in the sheet set can be used in object such as fields

Creating Subsets in Sheet Set Manager
Creating subsets in Sheet Set Manager is a fast way to organize and find what is needed in a big drawing set. To create a subset, right click on the sheet set and then to New Subset.

The Subset Properties box will pop up. Most of the properties are basic. Select OK.
A new subset is added to the sheet set manager.
Tip: To move a sheet to the new subset, simply click and drag to the desired subset.
Publishing Sheet Sets Sheet Set Manager makes it simple to publish a full set or only select sheets of the construction documents. There are two ways to plot: Publish directly to the plotter/file or use the Publish dialog box.
Publish and Plot directly to the plotter/file
Right click on the sheet set, scroll to Publish, and then Publish to Plotter.
This method is used to plot and publish when the page setup is set per layout. The drawback to using this option is if someone plots one of the sheets using the plot command and saved the setup to the layout, the layout will not publish properly. Sheetset can also be packaged and shared through e-transmit.

Publishing using Publish dialog box may not be as fast as Publishing directly to the plotter/file, but there is less of a chance the document will come out wrong.

You are also able to use Page Setups saved in the drawing to particular sheets or the full set.
To pull up the dialog box, right click the Sheet Set title, scroll to Publish, and then to Publish Dialog Box. The Publish Dialog Box will display.
Now with page setups, Publish Dialog Box can change the way the document is published. Now we have the options to publish to Plotter named in Page Setup, DWF, DWFx, and PDF.
Selecting the Sheet Set Publish Options allows the options to change information like default output location and naming.

Tip: One of the major options I change the most is type. Multi-sheet file will place the full set in one file and the Single-sheet file will place each sheet per file.
Control the Drawing Views
Redraw and Regenerate a Drawing
As you work on a drawing, visual elements may remain after the completion of a command. You can remove these elements by refreshing, or redrawing, the display.
To redraw (refresh) the current window display: View > Redraw Command line> REDRAW
To regenerate the current window: View > Regen Command line> REGEN

Information about drawing entities is stored in a database as floating point values, ensuring a high level of precision. Sometimes a drawing must be recalculated, or regenerated, from the floating point database to convert those values to the appropriate screen coordinates.
Magnify a View (Zoom)
Magnify a View (Zoom)

You can use ZOOM command to zoom in or zoom out the drawing view to meet your need. You can change the magnification of your drawing at any time. The cursor changes to a magnifying glass when a zoom tool is active. Zoom out to reduce the magnification so you can see more of the drawing, or zoom in to increase the magnification so you can see a portion of the drawing in greater detail.
Remark: If you are working in a layout viewport and cannot zoom, the layout viewport may be locked. The scale and view do not change in model space while panning or zooming in a locked layout viewport.
Zooming Methods
To zoom, you can use any of the following methods:
-To define the portion of the drawing to zoom, create a window. -To zoom in real time, use the Zoom Realtime tool on the Standard toolbar. -If you have a mouse with a wheel, rotate the wheel to zoom in and out.
Zoom to Magnify a Specified Rectangular Area
You can specify a rectangular area defined by two corners to display the objects within that area as large as possibly. The lower-left corner of the specified area becomes the lower-left corner of the new view.
To zoom in to an area using a window: View > Zoom> Window Command line> ZOOM
-Choose View > Zoom > Window -Select one corner of the window around the area you want to magnify. -Specify the opposite corner of the window around the area you want to magnify.


Zoom in Real Time
Realtime option zooms dynamically by moving your pointing device up or down. By right-clicking, you can display a shortcut menu with additional viewing options.

To zoom in real time: View > Zoom>Realtime Command line> RTZOOM
-Choose View > Zoom > Realtime from the main menu. -Hold the left mouse button, then drag the cursor forward to zoom in and move back to zoom out.
Displaying the Previous View of a Drawing
After you zoom in or pan to view a portion of your drawing in greater detail, you may want to zoom back out to see the entire drawing. On the View > Zoom menu, the Previous tool lets you restore the previous view. Selecting this tool repeatedly steps back through up to 25 successive zoomed or panned views.
Zooming to a Specific Scale
You can increase or decrease the magnification of your view by a precise scale factor measured relative to the overall size of the drawing or in relation to the current display. When you change the magnification factor, the portion of the drawing located at the center of the current viewport remains centered on the screen.
To zoom to a specific scale relative to the current display: View > Zoom>Scale Command line> ZOOM
-Choose View > Zoom > Scale from the main menu. -On the Zoom toolbar, click the Zoom Scale. -Type ZOOM in the command line, choose the Scale option, and then press Enter. -Type the scale factor, followed by an x (such as 2x). -Press Enter.


Displaying the Entire Drawing
ZOOM Extents option, displays a view that includes all of the objects in the drawing as large as possible. The view can display the objects on layers that are turned off but do not include objects on frozen layers.
ZOOM All option, displays all of objects within either the user-defined limits or the drawing extents, whichever view is larger.
You can use the Zoom All tool on the zoom toolbar to display an entire drawing. The Zoom Extents tool on the zoom toolbar displays the drawing to its extents, making the image fill the display to the greatest possible magnification.
Pan and View
You can move the drawing in any direction using the pan command. Panning shifts or slides the view of the drawing horizontally, vertically, or diagonally. The magnification of the drawing remains the same, as does its orientation in space. The only change is the portion of the drawing displayed. To pan, you can use any of the following methods:
-For precise panning, specify two points defining the magnitude and direction of the pan. The first point indicates the starting point of the pan. The second point indicates the amount of pan displacement relative to the first point.-To pan in real time, use the Pan Realtime tool on the Standard toolbar. -If you have a mouse with a wheel, press and hold the wheel, and then move the mouse.

To pan in real time: View > Pan>Realtime Command line>PAN
-Choose View > Zoom > Realtime from the main menu. -Move the cursor in the direction you want to pan. -To stop panning, press Enter, ESC or choose Exit from the shortcut menu.
To pan using a mouse with a wheel:
-Press and hold the wheel, and then move the mouse in the direction you want to pan (The MBUTTONPAN system variable controls this feature.)
Display Multiple Views on Model Space
When you begin a new drawing, it is displayed in a single window. You can view the drawing in a second window, or you can divide one window into multiple windows. You can also open and display multiple drawings.
Set Model Space Viewports

The viewports created on the Model tab completely fill the drawing area and do not overlap. As you make changes in one viewport, the others are updated simultaneously. You can do the following operations at the model space viewport:
-Set Snap, Grid, and UCS icon modes; Pan; Zoom; and restore named views. -Save orientations of UCS with individual viewports. -When executing a command, you can draw from one viewport to another. -Name a viewport arrangement in order to you can reuse it on the Model tab or insert it on a layout tab. -When you work on 3D models, is helpful setting up different UCS in individual viewports.
VPMAX/VPMIN
VPMAX allows you to expand the current layout viewports and switch to Model Space for editing without worrying about messing up viewports’ scales and limits, while VPMIN allows you to restore the current layout viewport.
| System Variable | Description | Value | Value Description |
|---|---|---|---|
| VPMAXIMIZEDSTATE | Controls whether to maximize the current viewport (read-only) | 0 | Do not maximize |
| 1 | Maximize |
VPMAX
Expands the current layout viewports to fill the screen and switches to Model Space for editing.
You can enter the viewport maximized state in the following four ways:
-
Enter the VPMAX command in the Layout Space, and then click to select the viewport to be maximized; (when there is only one viewport in the layout, the viewport will be maximized directly without the need to select)
-
Enter the VPMAX command after selecting a viewport in the layout space;
-
Double-click the viewport border in the Layout Space;
-

Click the maximize viewport icon on the status bar in the Layout Space.

VPMIN
Exits the maximized state and returns to the current Layout Space.
You can exit the viewport maximized state in the following three ways:
-
Enter the VPMIN command;
-
Double-click the blue border line;
-

Click the minimize viewport icon on the status bar in the Layout Space.
Working with Multiple Views of a Single Drawing
You can open and work with several views of the same drawing simultaneously. After you divide a single window into multiple windows, you can control each window separately. For example, you can zoom or pan in one window without affecting the display in any of the other windows. As you draw, any changes you make in one window are immediately visible in the others. And also you can switch from one window to another at any time.
To create multiple views: View > Viewports Command line> VPORTS
-Choose View> Viewports-In viewports menu, choose 1, 2, 3, or 4 viewports. -Type h if you want the horizontal orientation, or type v if you want the vertical orientation.
To join two views: View > Viewports> Join Command line> VPORTS
-Choose View > Viewports > Join -Click anywhere inside the window you want to keep. -Click anywhere inside the adjacent window you want to join to the first window.
To restore a named window configuration:
-Type -VPORTS system variable at the command line and press ENTER. -Then type Restore. -Then type the name of the window configuration you want to restore.


VPSCALE
The VPSCALE (viewport scale) command reports the real scale of the current viewport of a selected layout viewport.
-
You can open a recent drawing with layouts or create a new viewport on layout space with a desire scale according to paper format.
-
Type VPSCALE command on the command line, and then select the edge of the viewport.
-
The command line will show the correct viewport scale according to unit measure you are working with.
-
Notice the status bar shows the right scale of the selected viewport only at layout space.

Working with Multiple Drawings
With the multiple document interface, you can open and work on several drawings at one time, you can copy, cut, or paste an entity from one drawing to another. Each drawing appears in a drawing window, which has the following advantages: You can see two or more drawings side by side, and you can easily copy entities from one drawing to another. Under the Window menu, the following three methods that determine how drawings are arranged are provided for user's choice.

-Cascade -Tile Horizontally -Tile Vertically

View Manager
With the view manager, you can create, set current, update layers, edit boundaries, and deletes named views, and switch quickly between each views, it is helpful to reduce many unnecessary view adjust operation.
Specify a 3D View
You can set a 3D view to facilitate verifying the 3D effects of the drawing, constructing and visualizing 3D models. You can specify a new viewpoint to create new objects or modify the existing objects.
Set the Viewing Direction

You view three dimensional drawings by setting the viewing direction. The viewing direction establishes the viewing position, When you view a drawing from the default viewpoint (0,0,1), you see a plan view of the drawing. You can change the viewing direction to look at the drawing from a different vantage point or to work on a three dimensional model from a different orientation.
To set a new viewing direction: View >3D Views> Viewpoint Presets Command line> DDVPOINT
-Choose View > 3D Views > Viewpoint Presets -Set viewing angles at absolute to WCS and relative to UCS by moving the position of the needle according to your preference. Then click OK button.
To display a plan view of the current drawing: View > 3D Views> Plan View Command line> PLAN

-Choose View > 3D Views > Plan View from the main menu. -It concludes three plan views: Current UCS, World UCS and Named UCS. Choose one what you want.


Isometric View

Isometric View
You can define perspective views of a model to create realistic effects. Select predefined standard orthographic and isometric views by name or description. These views represent commonly used options: Top, Bottom, Front, Left, Right, and Back. In addition, you can set views from isometric options: SW (southwest) Isometric, SE (southeast) Isometric, NE (northeast) Isometric, and NW (northwest) Isometric.
Draw 2D Isometric Views
With Isometric Snap, you can create 2D objects that appear to be 3D solids.

By setting Isometric Snap on the Draft Settings dialog box and turning on Snap and Grid, you can easily align objects along one of three isometric planes. However, although the isometric drawing looks like 3D, it is actually a 2D representation.
Set Isometric Grid and Snap
By aligning along three major axes, isometric drawing simulates a 3D drawing from specified viewpoint. When the snap angle is set to 0, the axes of the isometric plane are 30 degrees, 90 degrees and 150 degrees. With Isometric Snap on, you can work on any of three isometric planes, each with a pair of associated axes.


-Left. The left isometric plane defined by a pair of 90- and 150-degrees axes. The snap and grips align along the 90- and 150-degree axes. -Top. The top isometric plane defined by a pair of 30- and 150-degrees axes. The snap and grips align along the 30- and 150-degrees axes. -Right. The right isometric plane defined by a pair of 90- and 30-degrees axes. The snap and grips align along the 90- and 30-degrees axes.
In addition to using ISOPLANE command to switch isometric planes, you can also use shortcut key F5 or CTRL+E. specifying one of the three isometric planes results in Ortho and crosshairs to be aligned along the corresponding isometric axes.

For example, when Ortho is on, the points you specified align along the simulated plane you are working on. Therefore, you can draw the top plane first, and switch to the left plane to draw another side, and then switch to the right plane to complete the drawing.

Top plane Left plane Right plane
Change a 3D View Dynamically
You can view objects from any viewing direction by holding down mouse or other pointing devices and moving dynamically. With dynamic viewing, you can display the effects of changing viewpoint while you change the view. You can execute move or zoom operations as the 3D Orbit is active. When the 3D Orbit is active, you are not allowed to modify objects. GstarCAD supports more orbit options like Free Orbit, 3D Continuous Orbit, Orbit along the X-axis, Orbit along the Y-axis, Orbit along Z-orbit and 3D Orbit Center. Additionally users can create two new meshes through DISH and DOME commands. To close 3D Orbit, press Enter, ESC or choose Exit from the shortcut menu.

Hide Lines or Shade 3D Objects

Hides or shapes for 3D objects in the current drawing, suppresses the display of the objects (partly or entirely) that are located behind other objects, or generates a simply shaded image displayed in the current view. You can use HIDE command to remove the hidden lines to verify the current placement of these surfaces. Hiding background lines makes the display much clearer, but you cannot modify hidden-line or render views.

Add Simple Shading to 3D Objects

Although hiding lines can enhance the drawing and clarifies the design, shading produces a more realistic image of your model. You can modify shaded objects as you normally would. When a shaded object is selected, the wireframe and grips appear on top of the shading.
Section Plane
SECTIONPLANE command creates a section object that acts as a cutting plane through 3D objects and saves the selected section plane as a 2D or 3D block. You can move the section object dynamically in a 3D model or in a surface area. You can use the active section to analysis model by moving the section object in the object. Create cross-sectional views that can be saved or reused.


Render

Rendering creates a 2D image based on a 3D scene. It shades the scene's geometry using the lighting you've set up, the materials you've applied, and environmental settings such as background and fog. At a basic level, you can use the render command to render your model without applying any materials, adding any lights, or setting up a scene. You cannot move or adjust this light.
Light

Lighting adds the finishing touch to the scene. You can add point lights, spotlights, and distant lights and set the location and photometric properties of each.
Point Light: A point light radiates light in all directions from its location and does not target an object.
Spotlights: A spotlight can be directed towards an object.
Distant Lights: Simulates the effect of sunlight and can be used to show how the shadows cast by a structure affect the surrounding area.
Light List: Displays a list of type and light name used in model. Distant lights and the sun do not appear as interface objects in the model.
Materials

Materials
You can add materials to objects in your drawings to provide a realistic effect. In the context of rendering, materials describe how an object reflects or transmits light. Within a material, maps can simulate textures, bump effects, reflections, or refractions.
Precision Tools and the Properties of Drawings
Specify Units, Angles and Scale
Specify the units of measurement you want to use, their format, and other conventions.
Set the Units Format

You can set the display format of the unit that includes: scientific, decimal, engineering, architectural and fractional notation. To enter architectural feet and inches format, you can indicate feet using the prime symbol ('), for example, 72'3. You do not need to specify inches by entering quotation marks (").You can set the unit type and precision in the Quick Setup wizard, the Advanced Setup wizard, or the Units Control dialog box. These settings control how your coordinate, offset, and distance entries are interpreted, and how coordinates and distances are displayed.
To open drawing units dialog: Format > Units Command line>UNITS
DWGUNITS
Different projects or application scenarios may require different units. For example, architectural design might use meters, while mechanical design might use inches. In GstarCAD 2025, the newly added DWGUNITS command allows you to change the units of drawings to meet the standard size and annotation requirements of the drawing and avoid errors due to using different units.
You can enter DWGUNITS command or click Ribbon
Express
Modify
DWG Units.

Command Line Prompts:
-
(1) Enter units for length <3>: The default unit for imperial drawings is "3. Millimeters" and for metric drawings is "1. Inches". Six common units are available.
-
(2) Enter linear display format<4>:

- (3) Enter linear display precision<4>:

- (4)

Controls whether objects inserted into the current drawing will be scaled according to existing objects. If set to "Yes," inserted objects may be scaled to better match the current drawing environment.
- (5)

Ensure that the dimensions of objects match the scale of the drawing. If set to "Yes," inserted objects will be measured and displayed using the same units as the current drawing.
- (6)

Controls whether the dimensions and scale of objects in the current drawing are adjusted to reflect the unit modification.
- (7)

Controls whether objects are included in pper space.
For example, when converting a drawing from imperial (inches) to metric (millimeters) units, After executing the DWGUNITS command, the unit of the object is modified:


Different options may lead to different prompts. Just follow the prompts on the command line for accurate instructions.
Set Angle Conventions

Set Angle Conventions
You can specify the location for angle 0 and the positive direction for the angle measurement: clockwise or counterclockwise. You can also specify the format and the number of decimal fraction.
-Specify the measurement unit and precision: The units include grad, radian, surveyor's unit and degree, minute and second.
-Specify where the angle measurement starts from: east, west, south, north or others. For example, to enter a coordinate relative to the current coordinate for a property line that is 54 feet, 7 inches long with a bearing of 60 degrees north, 12 minutes, 6 seconds east, enter @54'7"<n60d12'6"e.
-Specify the positive direction: counterclockwise or clockwise. The angle 0 can be set to any location.
Setting Scale Factors
Instead of drawing to a particular scale, you draw everything full size in the program. When you print your drawing, you can assign the scale at which the drawing is to print. Scale, however, does affect the way a few elements such as text, arrows, or linetypes print in your drawing. For example, when you draw text, you need to determine the text size so that when you print it later at a particular scale, the text height is correct.
After you determine the eventual scale of your finished drawing, you can calculate the scale factor for the drawing as a ratio of one drawing unit to the actual scale unit represented by each drawing unit.
The following table shows some standard architectural and engineering scale ratios and equivalent text heights required to create text that measures 1/8 inch high when you print the drawing at the specified scale.
| Standard scale ratios and equivalent text heights | ||
|---|---|---|
| Scale | Scale factor | Text height |
| 1/16" = 1'-0" | 192 | 24" |
| 1/8" = 1'-0" | 96 | 12" |
| 3/16" = 1'-0" | 64 | 8" |
| 1/4" = 1'-0" | 48 | 6" |
| 3/8" = 1'-0" | 32 | 4" |
| 1/2" = 1'-0" | 24 | 3" |
| 3/4" = 1'-0" | 16 | 2" |
| 1" = 1'-0" | 12 | 1.5" |
| 1 1/2" = 1'-0" | 8 | 1" |
| 3" = 1'-0" | 4 | 0.5" |
| 1" = 10' | 120 | 15" |
| 1" = 20' | 240 | 30" |
| 1" = 30' | 360 | 45" |
| 1" = 40' | 480 | 60" |
| 1" = 50' | 600 | 75" |
| 1" = 60' | 720 | 90" |
| 1" = 100' | 1200 | 150" |
You can use these scale factors to predetermine the size of your drawing to make sure that it fits on a specific size paper when you print it. You control the size of your drawing by the drawing limits. To calculate the drawing limits to match the size of your paper, multiply the dimensions of your paper size by your scale factor.
Drawing Limits
You can specify the drawing limits that form an invisible boundary around your drawing. You can use the drawing limits to make sure that you do not create a drawing larger than can fit on a specific sheet of paper when printed at a specific scale.

For example, if you plan to print your drawing at 1/8" = 1'-0" (in other words, using a scale factor of 96) on a sheet of paper measuring 36 inches x 24 inches, you can set drawing limits to 3,264 units wide (that is, 34 x 96) and 2,112 units high (22 x 96), which allows a 1-inch margin around the edges of the printed image.
To set the drawing limits: Format > Drawing limits Command line> LIMITS

-Choose Format > Drawing Limits -Specify the x-coordinate and y-coordinate of the upper right drawing limit and the lower left drawing limit. You can also click Select to specify the drawing limits by selecting points in the drawing.
Grid and Grid Snap

The grid is a rectangular pattern comprised of minor and major lines extended over the drawing area. Displaying grids and using grids snap improve the performance of regenerating. When you turn Snap mode on, the cursor adheres or snaps to the invisible grids. Grid and snap settings are effective tools to use in your drawing to ensure accuracy. In addition, the cursor can be restricted to move orthogonally only or guides can display on the screen automatically at specified polar angle increments.
Change Grid and Snap Spacing

ou can turn Grid and Snap on and off and specify their spacing on the Snap and Grid tab at the Drafting Settings dialog box. Grid spacing does not have to match snap spacing. A wide grid spacing can be used as a reference while a closer grid spacing helps you specify points accurately.

Use Object Snaps

Use Object Snaps
Object snaps enable you to quickly select exact geometric points on existing entities without having to know the exact coordinates of those points. With object snaps, you can select the endpoint of a line or arc, the center point of a circle, the intersection of any two entities, or any other geometrically significant position. You can also use object snaps to draw entities that are tangent or perpendicular to an existing entity.
Setting Object Snaps

You can set object snaps using any of the following methods:
-Choose Tools > Drafting Settings > Object Snap, and then click one of the object snap tools. -On the Object Snap toolbar, click one of the object snap tools. -On the status bar, right-click on the Object Snap button to choose Settings. -Press and hold down the Shift key while right clicking anywhere within the drawing window to display the object snap shortcut menu, and then choose the object snap you want to set.

Additionally, you can find an option called Distance from Endpoint. This option allows snap a certain distance from any endpoint of objects like line, arc, spline, pline, ellipse arc, mline and any other lines. As long as you pass the cursor over an object from its endpoints, you will see a green snap point at accurate distance.

Another option called Divide Segments allows snap the divided segment points of objects like line, arc, spline, pline, ellipse arc, mline and any other lines. Before, if you want to find the divide point, first you need to generate the divided points object, then snap those points to draw. Now as long as you pass the cursor over an object mentioned above, you will see a green snap point at accurate distance.
AutoSnap Tools

AutoSnap Tools
The automatic snap tool is a visual aid tool for snapping that help you see and use object snaps more efficiently. When any object snap is on, the system displays a marker and a tooltip when you move your cursor on over a snap point. AutoSnap turns on automatically when an object snap is on. By default, AutoSnap marker, tooltip and magnet are on. You can change the settings of AutoSnap on the Options dialog box. AutoSnap consists of the following snap tools:
-Marker. The object snap location is displayed when the cursor moves over or near an object. Marker shape is determined by the snap it is marking.
-Tooltip. Indicates which part of the object you are snapping to in a flag at the cursor location.
-Magnet. Attracts and locks the cursor onto the nearest detected snap points.
-Aperture box. Surrounds the crosshairs and defines an area within which, when you move the cursor, system evaluates objects for object snaps. You can determine the aperture box is displayed or not, and the aperture box size can be changed too.
Selection Cycling
With the new SELECTIONCYCLING system variable you can quickly select overlapped or coincident objects in current drawing as well as set selection cycling options.


The Selection Cycling button is located on status bar. Right-click the button to specify the selection cycling settings. These settings control whether a badge or the Selection dialog box displays when you hover over or select an overlapping object.
Allow selection cycling: Turns on/off the selection cycling functionality. You can also set this option with the SELECTIONCYCLING system variable.
Display selection cycling list box: Displays the Selection Cycling list box.
Cursor-dependent: Moves the list box relative to the cursor position according to quadrant (Top Left, Top Right, Bottom Right, Bottom Left), distance in pixels or just static.
Show title bar: To save screen space, turn the title bar off.
To select overlapping objects, make sure that make sure that Selection Cycling on status bar is turned on. As you roll your cursor over objects, you will see an icon indicating that multiple objects are available for selection. Click to see a list of available objects, and then click in the list to select the object you want.

Use Polar Tracking and Object Snap Tracking
Auto tracking includes polar tracking and object snap tracking. You can turn them on and off by repressing POLAR and OTRACK buttons on the Status Bar. When the polar tracking mode is on, the cursor moves along the specified angle. When the object snap tracking is on, the cursor moves along an alignment path based on the snap point.
Polar Tracking

Polar Tracking
Guides display on the screen automatically at the polar angle increment that you specify when polar tracking is turned on. For example, if you draw a line with angle increment set as 65 degrees with polar tracking turned on, the rubber-banding line displays at 65 degree increments.
To enable polar tracking and specify the polar angle increment:
1.Do one of the following:-Choose Tools > Drafting Settings from the main menu. -On the Object Snap toolbar, click the Object Snap Settings button. -Type DSETTINGS in the command line and then press Enter. 2.Switch to the Polar Tracking tab. 3.Select the Polar Tracking On checkbox. 4.Do one of the following to specify the polar


angle increments: -Select an angle from the Increment Angle drop-down list. -Mark the Additional Angles check box and click New to define a custom angle increment. 5.Click OK.
Remark: To toggle polar tracking on and off at any time, click the Polar Tracking button on the status bar or press F10.

To draw objects using polar tracking:
-Turn on polar tracking and start a drawing command, such as ARC, CIRCLE, or LINE. You can also use polar tracking with editing commands, such as COPY and MOVE.
-As you move your cursor to specify points, notice the dotted polar tracking line that appears at the tracking angles you specified. Points you specify while the line is displayed conform to the polar tracking angle.
Object Snap Tracking
Object snap tracking can track along alignment paths that are based on object snap points and display tooltips at the acquired points. After you acquire a point, horizontal, vertical and polar alignment paths relative to the point are displayed when the cursor moves over their drawing path. For example, you can specify a point along a path that is based on an object endpoint or midpoint or an intersection between objects.
You can also use system variable TRACKPATH to control the display of polar and object snap tracking alignment paths.

Use Orthogonal (Ortho Mode)

You can restrict cursor movement to the current horizontal and vertical axes so that you can draw at right angles, or orthogonally. For example, when the Draw Orthogonal option is enabled, lines are restricted to 0 degrees, 90 degrees, 180 degrees, or 270 degrees. As you draw lines, the rubber banding line follows either the horizontal or vertical axis, depending on which axis is farthest from the cursor. When you enable the isometric snap and grid, cursor movement is restricted to orthogonal equivalents within the current isometric plane. Ortho mode and polar tracking cannot be on at the same time. Turning on Ortho turns off polar tracking.
To fast enable orthogonal drawing:
-Press F8 or press the ORTO button at the status bar
Working with Linetypes

A linetype is a repeating pattern of dashes, dots, and blank spaces displayed in a line or a curve. You can assign linetypes to objects by layer, or by specifying the linetype explicitly. And also, you can specify its scale, load more linetypes into the program from a linetype library file, and create your own custom linetypes.
By default, every drawing has at least three linetypes: CONTINUOUS, BYLAYER, and BYBLOCK. You cannot rename or delete these linetypes.
Remark: You should not confuse these linetypes with the hardware linetypes provided by some plotters. Both linetypes of dashes produce the similar effects. However, if you use both linetypes at the same time, the results can be unpredictable.
Load Linetypes


GstarCAD includes the linetype definition files gcad.lin and gcadiso.lin. If you select gcadiso.lin, you can use ISO pen-width option when you plot.If you want to know what linetypes are already available, you can display a list of linetypes that are loaded in the drawing or stored in an LIN (linetype definition) file. Both linetype definition files contain several complex linetypes.
Change the Linetype of an Object

Change the Linetype of an Object
You can change the linetype of an object by changing the linetype of the layer the object is on, reassigning the object to another layer, or by specifying a linetype for the object directly.
Set the Current Linetype

Set the Current Linetype
By default, all objects are created using the current linetype, which is displayed in the Linetype Control on the Properties toolbar. To modify this current linetype, you can select a linetype and make it current in the Linetype Manager dialog box. If the current linetype is BYLAYER, objects are created using the linetype assigned to the current layer.
If the current linetype is BYBLOCK, objects are created using CONTINOUS linetype until they are grouped into a block. When you insert the block, it acquires the current linetype setting.
To make the linetype current:
Select a linetype from the Linetype Control pull-down list on the Properties toolbar, which is set to the current linetype.
Control Linetype Scale
You can set global or individual scales for objects to control the display of linetypes. The Global Scale Factor and Current Object Scale are displayed in the Linetype Manager. The Global Scale Factor value is stored in the system variable LTSCALE, which changes the linetype scale globally for new and existing objects.

The Current Object Scale is stored in the system variable CELTSCALE, which specifies the linetype scale for new objects. In a layout, you can use system variable PSLTSCALE to adjust the linetype scale in different viewports.
Remark: Setting the linetype scale too large or too small may result in a line pattern looking like a solid line, depending on what the scale view is or at what scale the drawing is printed.
To set the current individual linetype scale: Format > Linetype Command line> LINETYPE
-Choose Format > Linetype-Click the Show Details button.-In the Current Object Scale field, type the linetype scale that you want to make current.-Click OK.
To change the global linetype scale: -Choose Format > Linetype-Click the Show Details button.-In the Global Scale Factor field, type the global linetype scale that you want to change. Then click OK button.
Working with Layers

Layers are like the transparent overlays you use in manual drafting. You use layers to organize different types of drawing information. Each object in a drawing exists on a layer. When you draw an object, it is created on the current layer.
Create and Name Layers
You can create an unlimited number of layers in every drawing and use those layers for organizing information. When you create a new layer, it is initially assigned the color white (or black, depending on your system settings) and the linetype CONTINUOUS. By default, a new layer is also visible. After you create and name a layer, you can change its color, linetype, visibility, and other properties.
To create a new layer: Format > Layer Command line> LAYER
-Choose Format > Layer-Click the New Layer button. -Type a name for the new layer and then click OK.
To change a layer name in the current drawing:
-Choose Format > Layer-In the Layer Properties Manager dialog box, click the name of layer you want to change. -Type a new name and click OK button.
Setting the Current Layer

Setting the Current Layer
When you start a drawing, objects are created in the current layer. By default, the layer 0 is set to the current layer, but you can also create a new one and make it current. Any subsequent objects you create are associated with the current layer and use its color and linetype.
To make a layer current:
-Choose Format > Layer-In the Layer Properties Manager dialog box, select a layer and then click the Set Current button to make the layer current.-Click OK.
Removing Layers
You can remove unused layers from your drawing with PURGE or by deleting the layer from the Layer Properties Manager.
Controlling Layer Visibility

Controlling Layer Visibility
A layer can be visible or invisible. Objects on invisible layers are not displayed and do not print. By controlling layer visibility, you can turn off unnecessary information.
To turn layers on or off: Format > Layer Command line> LAYER
-Choose Format > Layer -Click the icon under "On" tab in the layer list. -Click OK button.
Locking and Unlocking Layers

Locking a layer prevents you from accidentally modifying its objects. You cannot edit a layer when it is locked (but visible and thawed). If you lock the current layer, you can still add new objects to it. You can also change the linetype and color associated with a locked layer. Unlocking a layer restores full editing capabilities.
To lock or unlock layers: Format > Layer Command line> LAYER
-Choose Format > Layer from the main menu. -Click the icon under "Lock" tab in the layer list. -Click OK button.
Controlling Layer Printing

Controlling Layer Printing
Controlling layer printing is another way you can specify which objects print in your drawing. By controlling layer printing, you can turn off unnecessary information during printing. When you turn off printing for a layer, objects drawn on that layer are still visible, but they do not print.
To turn layer printing on or off: Format > Layer Command line> LAYER
-Choose Format > Layer
-Click the icon under "Plot" tab in the layer list.
-Click OK button.
Setting a Layer's Print Style
If your drawing uses named print style tables, you can specify a print style for each layer. Named print style tables contain print styles that you set up to control what objects look like when they print, without actually changing the objects in the drawing. If your drawing uses color-dependent print style tables, you cannot specify a print style for a layer. These types of print style tables automatically determine printing requirements by the color assigned to a layer or an object.
To change the print style assigned to one or more layers (only in a drawing that uses named print style tables):

Format > Layer Command line> LAYER
-Choose Format > Layer -Click the name of Plot Style in the layer list to open Select Plot Style dialog box, from which, you can specify the desired plot style. -Click OK button.
Freeze or Thaw Layers
You can also freeze layers to improve the performance of operations such as zooming and panning or producing hidden lines or shaded images. When a layer is frozen, objects drawn on that layer are no longer visible.
To freeze or thaw layers: Format > Layer Command line> LAYER

-Choose Format > Layer -Click the icon under "Freeze" tab in the layer list. -Click OK button.
Setting the Layer Color

Setting the Layer Color
Each layer in a drawing is assigned a color. GstarCAD uses the BYLAYER color as the default color setting for object creation so that new objects are drawn in the color of the layer on which they are inserted.
To change the layer color: Format > Layer Command line> LAYER
-Choose Format > Layer -Click the icon under "Color" tab in the layer list to open Select Color dialog box, from which, you can specify the desired color through index, true and color books tabs–Then click OK button.
Setting a Layer's Linetype

Each layer uses a default linetype. Linetype determines the appearance of objects both on the screen and when printed. It's recommendable to assign the BYLAYER linetype to any objects that you draw on that layer.
To change the linetype assigned to one or more layers: Format > Layer Command line> LAYER
-Choose Format > Layer -Click the Linetype name in the layer list to open Select Linetype dialog box, from which, you can specify the desired linetype. -Click OK button.
Setting a Layer's Lineweight

Each layer uses a default lineweight. Lineweights determine the thickness of objects both on the screen and when printed. All new layers are assigned the DEFAULT lineweight, which is .25 millimeters or .01 inches. If you want a different lineweight assigned to a layer, you can easily change it using Layer Properties Manager.
To change the lineweight assigned to one or more layers: Format > Layer Command line> LAYER
-Choose Format > Layer -Click the Lineweight name in the layer list to open Lineweight dialog box, from which, you can specify the desired lineweight. -Click OK button.
Filter List of Layers

You can use a layer filter to limit the display of layer names in the Layer Properties Manager. The following properties can be included in the filter definition: Layer names, colors, linetypes, lineweights, and plot styles, Whether layers are locked or unlocked, turned on or off, frozen or thawed in the current viewport or all viewports. When setting filter conditions, you can also use wild-card characters to filter names by name. For example, typing D* displays layer name preceded with D, just click Add button if the filter name has been specified.
To filter list of layers:
-Choose Format > Layer -Click the New Property Filter icon, located at top left of the window. –In the Layer Filter Properties dialog box, under filter definition, click the tabs properties you want to filter. Then click OK.
LAYULKALL
If you have a lot of layers locked and need to unlock them all in you drawing, you can input LAYULKALL command to unlock all the locked layers immediately.

Dislaying Lineweights
Lineweights are displayed differently in paper space layout than model space. Lineweights are useful for graphical representations of different objects and information.
Display Lineweights in Model Space

In model space, a 0-value lineweight is displayed as a pixel, and other lineweights are display with a pixel width proportional to their real-unit value. In model space, lineweight display does not change with the zoom factor. A lineweight value that is represented by a width of several pixels is always displayed using the same number of pixels. In model space, press LWT button on the status toolbar to turn lineweight display on and off.
Display Lineweights in Layouts
In paper space (layout tab), lineweights are displayed in exact plotting width. In plot preview and paper space, lineweights are displayed in real-world units, and lineweight changes with the scale factor. From the Plotting Scale tab of Plot dialog box, you can control the lineweight plotting and scaling in a drawing. In paper space, press LWT button on the status toolbar to turn lineweight display on and off. This change does not affect the lineweight plotting.

Spell Command
Users can check the spelling of all text as it is entered in your drawing with Spell command. Users can also specify the specific language dictionary that is used and customize and manage multiple custom spelling dictionaries.

Hardware Acceleration

Hardware Acceleration
Hardware Acceleration leverages the GPU, which excels at handling images, to assist the CPU, thereby enhancing graphic display quality and work efficiency, and improving overall performance. Enabling hardware acceleration provides more efficient, high-quality real-time display effects compared to the CPU, and offers better highlight effects.

Hardware Acceleration can automatically determine whether to activate based on the user's hardware configuration. It can also be manually controlled using the command GRAPHICSCONFIG, or by clicking the Performance Settings icon in the status bar.

- Hardware Configuration:
Displays the current user's hardware environment, including the Graphics Card, Driver Version, and OpenGL version information.
- Graphics Display Settings:
Hardware Acceleration: Enable to activate Hardware Acceleration, using GPU for optimized graphics rendering. If disabled, the mode switches to the default "Software Mode”.
Smooth Line Display: Removes jagged edges from the graphic for a smoother display.
| System Variable | Description | Value | Value Description |
|---|---|---|---|
| HARDWAREACCELERATE | Indicates whether Hardware Acceleration is enabled or disabled. (Read-only) | 0 | Disabled |
| 1 | Enabled |
If hardware acceleration cannot be enabled, it may be due to the hardware environment not meeting the requirements:
-
OpenGL version below 4.2 or outdated driver version. You can try upgrading the system's graphics driver.
-
If you encounter compatibility or performance issues, you can try disabling hardware acceleration.
-
To ensure the best software experience, Windows 7 and earlier versions of the operating system are not supported.
If your system has dual graphics cards (dedicated and integrated), it is recommended to manually set the high-performance graphics card to achieve better display performance. The method to set the high-performance graphics card depends on the graphics card model and its corresponding software and driver version. Taking Windows 11 as an example, the manual setting method is as follows:
-
Right-click on the desktop and select "Display settings".
-
In "Display settings", find "Graphics".
-
On the "Graphics" page, under "Custom options for apps", click "Browse", find gcad.exe in the installation path, and add it to the list.
-
Click on the GstarCAD application in the list and then click "Options".
-
In the Graphics preference dialog box, select "High performance" and click save.
Compared to the previous version, GstarCAD 2025 shows improved display effects in the following areas:
Highlight Display
Hardware Acceleration provides clearer highlighting effects, marking selected objects more distinctly. This allows users to identify, select, and operate more accurately, enhancing the user experience.

| System Variable | Description | Value | Value Description |
|---|---|---|---|
| SELECTIONEFFECT | Controls the highlight display mode of selected objects when Hardware Acceleration enabled | 0 | Dashed lines |
| 1 | Blue glowing line highlighting effect | ||
| SELECTIONEFFECTCOLOR | Sets the color of the glowing highlighting effect when objects are selected Note: Only applies when SELECTIONEFFECT is set to 1. | 0 | Valid values are from 0 to 255 |


Basic Visual Styles Support
Added support for two visual styles: Conceptual and X-ray:
-
Conceptual Visual Style: Typically used in the early design stages, this style makes the graphics appear simpler.
-
X-ray Visual Style: Allows for a clearer view of the relationships between objects.
These visual styles control the display of drawings, making objects clearer and improving drawing efficiency.


Conceptual X-ray
Lighting Improvements
GstarCAD optimized lighting, making the effects softer and allowing adjustments based on real-time preview. Key improvements include:
-
Point Light: Provides uniform illumination in all directions, suitable for simulating indoor lighting or general ambient lighting.
-
Spotlight: Concentrates light in a small area, ideal for highlighting specific objects or emphasizing focal points.
-
Web Light: Displays the range or area formed by the light, simulating the radiation range of light.
-
Target Point Light: Specifies a point as the light source, commonly used to simulate a light bulb or flame.
-
Free Web: Illuminates the surrounding environment without being blocked by surrounding objects.


Hardware Acceleration OFF Hardware Acceleration ON
Create Objects
Drawings are made up of objects. In general, you draw objects by specifying points with the pointing device or by entering coordinate values at the command prompt.
Draw Linear Objects
Lines
A line consists of two points: a start point and an endpoint. You can connect a series of lines, but each line segment is considered a separate line object. To draw a line: Draw > Line Command line> LINE

1.Choose Draw > Line from the main menu. 2.Specify the start point. 3.Complete the first line segment by specifying the endpoint. 4.Press Enter to complete the command.
To start a new line at the endpoint of the last line drawn, start the Line command again and press Enter directly at the "Specify first point:" prompt.
Multilines
Multilines consist of several parallel lines, called elements.
You can determine the position of elements by specifying offset from the origin of each element. By default, multiline objects contain two elements. You can create and save new multiline styles by yourself or modify existing mline styles.

To draw a multi-line: Draw > Multiline Command line> MLINE

1.Choose Draw > Multiline from the main menu. 2.Specify the start point. 3.Specify the endpoint. 4.Press Enter to complete the command.

Rays

Rays
A ray is a line in three dimensional space that starts at a point and extends to infinity. Because rays extend to infinity, they are not calculated as part of the drawing extents. The default method for drawing a ray is to select the start point of the ray and then specify its direction.
To draw a ray:
Draw > Ray Command line> RAY
1.Choose Draw > Ray from the main menu. 2.Specify the start point and the direction. 3.Press Enter to complete the command.
Construction Lines

A construction line is a line through a given point, oriented at a specified angle in three dimensional space and extending to infinity in both directions. You can also draw a construction line at a specific angle or at an angle relative to an existing object.
To draw a construction line: Draw > Construction Line Command line> XLINE
1.Choose Draw > Construction Line from the main menu. 2.Specify a point along the line. 3.Specify the direction. 4.Press Enter to complete the command.
Polylines

Polylines
A polyline is a single object with connected sequence of line segments or/and arc segments.When you draw a polyline, you can switch to different options. After you draw more than one segment, you can close the polyline, undo or finish.
To draw a polyline with straight segments: Draw > Polyline Command line> PLINE
1.Choose Draw > Polyline from the main menu. 2.Specify the start point. 3.Specify the endpoint of each segment. 4.Press Enter to end, or enter c (close) to close the polyline.

To draw a line and arc combination polyline: Draw > Polyline Command line> PLINE
1.Choose Draw > Polyline from the main menu. 2.Specify the start point. 3.Specify the endpoint. 4.At the command prompt, choose Arc. 5.Specify the endpoint of the arc segment. 6.To complete the command, Press ENTER.
To create closed polylines: Draw > Polyline Command line> PLINE

When creating polylines with PLINE command, the Close option is only available if no less than two line or arc segments are drawn. A closed polyline object is drawn if you connect the start point of the polyline to endpoint of the last line or arc segment with a line or arc.

To create wide polylines: Draw > Polyline Command line> PLINE
You can draw polylines of various widths by using the Width and Halfwidth options of PLINE command. The Width and Halfwidth options set the width of the next polyline segments you draw. You can set the width of individual segments and make them taper gradually from one width to another.

To draw a boundary polyline: Draw >Boundary Command line>BOUNDARY

1.Choose Draw > Boundary from the main menu. 2.Specify the objects by doing one of the following:
-Current viewport Define a boundary set with all entities in the current viewport. if this option is selected, any boundary set currently used will be canceled.
-Existing set Click New button to switch to the drawing area, and prompt users to select objects for defining boundary sets. Press Enter to return to the dialog box after selection. This option is only available after selecting objects by using the New button.
3.Select the Island Detection option. 4.Click Pick Points. 5.In the drawing, click inside the area whose closed perimeter forms the boundary, not on the polyline itself. If desired, continue clicking inside additional closed perimeters. 6.To complete the selection, press Enter. 7.In the Boundary Creation dialog box, click OK.


Polygons

Polygons
Creating polygons is a simple way to draw squares, equilateral triangles, octagons, and so on. Polygons are closed polylines with between 3 and 1,024 equal-length sides.
To draw a polygon by vertex: Draw >Polygon Command line>POLYGON
1.Choose Draw > Polygon from the main menu. 2.Type 6 to specify six sides for the polygon. 3.Specify the center of the polygon. 4.Specify the vertex of the polygon.
Rectangles
Rectangles are closed polylines with four sides. You draw a rectangle by specifying its opposite corners. The rectangle is normally aligned parallel to the current snap and grid alignment, but you can use the Rotated option to align the rectangle to any angle.

To draw a rectangle: Draw > Rectangle
Command line>RECTANG
1.Do one of the following: -Select Draw > Rectangle on the main menu. -Click the Rectangle tool or type RECTANG command and press Enter.
2.Identify one corner of the rectangle or enter an option. Specify first corner point or [Chamfer/Elevation/Fillet/Thickness/Width]:
3.Identify the opposite corner of the rectangle or enter an option. Specify other corner point or [Area/Dimensions/Rotation]:
Points
You can draw a point object formatted as either a single dot or as one of 19 other possible display styles.

To draw a point: Draw > Point Command line>POINT
1.Choose Draw > Point > Single Point from the main menu. 2.Specify the location of the point.
To draw several points:

1.Choose Draw > Point > Multiple Point from the main menu. 2.Specify the location of each point.
To change the size and appearance of point objects: Format > Point Style Command line>DDPTYPE
1.Choose Format > Point Style from the main menu. 2.Under Point Style, select the style you want. 3.Under Point Size, specify the point size, or choose one of the options. 4.Click OK button.
When you regenerate the drawing, all point objects change to reflect the new size and appearance settings.
Freehand Sketches
A freehand sketch consists of many straight line segments, created either as individual line objects or as a polyline. Before you begin creating a freehand sketch, you must set the length, or increment, of each segment. The smaller the segments, the more accurate your sketch, but segments that are too small can greatly increase the file size.

To create a freehand sketch:
1.On the command line, enter SKETCH and press Enter. 2.At the "Record increment" prompt, enter the minimum line segment length. 3.Move the cursor to the drawing area, then click or enter p (pen) to begin sketching. 4.Click or enter p (pen) again to lift the pen up and stop drawing, so that you can move the cursor around the drawing area without drawing. 5.Enter R (Record) at any time to write into the drawing the line you're drawing and those already drawn. 6.Press Enter to complete the sketch and write all lines into the drawing.

To erase freehand sketch lines:
1.While running the SKETCH command, enter E. If the pen was down, it moves up. 2.Move the cursor to the end of the line you drew last and then move it back as far along the line as you want to erase. 3.To end the erasure and return to the sketch Command prompt, enter E. If you want to change the current viewport while sketching, make sure the pen is up and all lines were written into the drawing.
Draw Curved Objects
Arcs
An arc is a portion of a circle. There are numerous ways to define an arc, the default method uses three pick points, a start point, a second point and an end point. Using this method, the arc will start at the first pick point, pass through the second point and end at the third point. Once you have mastered the default method try some others:
-3 points
-Start, Center, End
-Start, Center, Angle


-Start, Center, Length
-Start, End, Angle
-Start, End, Direction
-Start, End, Radius
-Center, Start, End
-Center, Start, Angle
-Center, Start, Length
-Continue

To draw an arc by 3 points as sample: Draw > Arc>3 points
1.Choose Draw > Arc > 3 Points from the main menu. 2.Specify the start and second points. 3.Specify the endpoint.
Circles
The default method for drawing a circle is to specify a center point and radius. You can draw circles using any of following methods:
-Center, Radius
-Center, Diameter
-Concentric -2 points
-3 points -Tangent, Tangent, Radius
-Tangent, Tangent, Tangent

To draw a circle by specifying its center and radius:Draw > Circle>Center, Radius Command line>CIRCLE
1.Choose Draw > Circle > Center, Radius from the main menu. 2.Specify the center point. 3.Specify the radius of the circle.

To draw a circle tangent to existing objects: Draw > Circle>Tan, Tan, Radius Command line>CIRCLE
1.Choose Draw > Circle > Tan, Tan, Radius from the main menu. 2.Select the first tangent point on the object to be tangent with the circle. 3.Select the second tangent point on the object to be tangent with the circle. 4.Specify the radius of the circle.
Ellipses
The default method for drawing an ellipse is to specify the endpoints of one axis of the ellipse, and then specify a distance representing half the length of the second axis. The endpoints of the first axis determine the orientation of the ellipse. You can draw ellipses using any of the following methods:
-Center -Axis, End -Ellipse, Arc

To draw an ellipse by specifying the axis and endpoints: Draw > Ellipse>Axis Command line>ELLIPSE
1.Choose Draw > Ellipse > Axis, End from the main menu. 2.Specify the first endpoint and second endpoint.3.Specify a distance for half the length of the second axis.

To draw an elliptical arc by specifying the axis endpoints: Draw > Ellipse>Arc Command line>ELLIPSE
1.Choose Draw > Ellipse > Arc from the main menu. 2.Specify the first endpoint. 3.Specify the second endpoint. 4.Specify the half length of the other axis. 5.Specify the start angle of the arc. 6.Specify the end angle.
Splines

Spline is a smooth curve that passes through a series of control points. Multiple points are required for drawing irregular splines than can be closed as well, so the start and endpoints are coincident and tangent. The tolerance in a spline, describes how precisely fits between multiple points (lower tolerance, more closely the spline fits the points). Usually there are two ways to create splines:
-Create a spline converted from a polyline using Spline option of PEDIT command. -Create a spline using SPLINE command.
To draw a spline: Draw > Spline Command line>SPLINE
1.Choose Draw > Spline from the main menu. 2.Specify the first point of the spline. 3.Specify the second point of the spline. 4.Specify as many more points as you want. 5.When you have finished, press Enter.

To draw a closed spline: Draw > Spline Command line>SPLINE
1.Choose Draw > Spline from the main menu. 2.Specify the first point of the spline. 3.Specify the second point of the spline. 4.Specify as many more points as you want. 5.When you have finished, on the command line, type C and press Enter. 6.To complete the command, specify the tangent point.


Helix

Helix
Creates a 2D spiral or 3D spring. Initially, the default base radius is set to 1. During a drawing session, the default value for the base radius is always the previously entered base radius value for any solid primitive or helix. The base radius and top radius cannot both be set to 0.
To draw a helix: Draw > Helix Command line>HELIX
The following prompts are displayed: Number of turns = 3 (default)Twist = CCW (default)
1.Specify center point of base: Specify a point
2.Specify base radius or [Diameter] <1.0000>: Specify a base radius, enter d to specify the diameter, or press ENTER to specify the default base radius value
3.Specify top radius or [Diameter] <1.0000>: Specify a top radius, enter d to specify the diameter, or press ENTER to specify the default top radius value
4.Specify helix height or [Axis endpoint/Turns/turn Height/tWist] <1.0000>: Specify a helix height, or enter an option


Donut
Donuts are solid, filled circles or rings created as closed, wide polyline. The system variable FILLMODE controls whether to fill the donut or not. FILLMODE is set to 1, creates filled donuts; if FILLMODE is set to 0, creates without filled.

To create a donut, you specify its inside and outside diameters and its center. You can continue creating multiple copies with the same diameter by specifying different center points. To create solid-filled circles, you can just assign the same value for the inside radius and outside radius.
To draw a donut: Draw > Donut Command line>DONUT
1.Choose Draw > Donut from the main menu. 2.Specify the inside diameter of the donut. 3.Specify the outside diameter of the donut. 4.Specify the center of the donut. 5.Specify the center point to draw another donut, or press Enter to complete the command.
Create 3D Objects
With 3D models, you can: View entities in three dimensions, create three-dimensional entities, edit entities in three-dimensional space, edit three-dimensional solids, display hidden-line and shaded views of three-dimensional entities.
3D Thickness and Elevation

3D Thickness and Elevation
By default, the program creates new two dimensional objects with a zero elevation and thickness. The easiest way to create a three dimensional object is to change the elevation or thickness property of an existing two dimensional object. You can extrude any two dimensional object into a three dimensional object by changing the thickness of the object to a nonzero value. For example, a circle becomes a cylinder, a line becomes a three dimensional plane, and a rectangle becomes a box.
To set the current elevation: Command line>CHANGE

1.Type CHANGE on the command line, and then press Enter after selecting the two dimensional object(s).2.Enter P (Properties) and press Enter. 3.Enter E (Elev) and press Enter. 4.Specify a new elevation, and then press Enter.
To set the current thickness: Command line>CHANGE
1.Type CHANGE on the command line, and then press Enter after selecting the two dimensional object(s). 2.Enter P (Properties) and press Enter. 3.Enter T (Thickness) and press Enter. 4.Specify a new Thickness, and then press Enter.
3D Faces

3D Faces
You can create a three dimensional face, which consists of a section of a plane in three dimensional space. After you specify the fourth point, the program continues to prompt you for additional faces by alternating prompts for the third point and fourth point to allow you to build a complex three dimensional object.

To create a three dimensional face: Draw > Modeling>Meshes>3D Face Command line>3DFACE
1.Type 3Dface on the command line. 2.Specify the first point of the three-dimensional face. 3.Specify the second, third, and fourth points. 4.Specify the third and fourth points for additional faces. 5.To complete the command, press Enter.
Ruled Surfaces

Ruled Surfaces
You can create a ruled surface, which is a three-dimensional body that approximates the surface between two existing entities. You select the two entities that define the ruled surface. These entities can be arcs, circles, lines, points, or polylines.
To create a ruled surface:Draw > Modeling>Meshes>Ruled Mesh Command line>RULESURF
1.Type RULESURF on the command line. 2.Select the first defining object. 3.Select the second defining object.
Tabulated Surface

Tabulated surface meshes are used as a serial of paralleled polygon on specified path, you should draw direction vector and original object before creating a tabulated surface. The objects like a line, arc, circle, ellipse, or 2D or 3D polyline can be used as outline curves for defining polygons.
To create an extruded surface mesh: Draw > Modeling>Meshes>Tabulated Mesh Command line>TABSURF
1.Type TABSURF on the command line. 2.Select the object to extrude. 3.Select the extrusion path.
Revolved Surface
Use REVSURF command to create a surface of revolution by rotating a profile of the object about an axis. The object to be revolved can be a line, arc, circle, ellipse, elliptical arc, closed polyline, polygon, closed spline or torus. REVSURF is useful for surfaces with rotational symmetry.
To create a revolved surface mesh: Draw > Modeling>Meshes>Revolved Mesh Command line>REVSURF
1.Type REVSURF on the command line. 2.Select the object to revolve. 3.Select the object to be used as the axis of revolution. 4.Specify the starting angle. 5.Specify the number of degrees to revolve the object.

Solid Box
A solid box consists of six rectangular surface planes. The base of the box is always parallel with the xy plane of the current UCS. The length of the box is mapping to X axis of current UCS, and its width maps to Y axis, and height maps to Z axis. RECTANG or PLINE command creates a rectangle or closed polyline from which you can create a box using EXTRUDE.

To create a box: Draw > Modeling>Box Command line>BOX

1.Choose Draw > Modeling > Box from the main menu. 2.Specify the first corner of the base. 3.Specify the opposite corner of the base. 4.Specify the height.
Solid Cone
By default, the cone's bottom lies on the XY plane of the current UCS. The cone height is parallel to the Z axis. The apex determines the height and orientation of the cone. You can draw a 2D circle and then use EXTRUDE to taper the circle at an angle along the Z axis to create a solid cone. To complete the truncation, you can subtract a box from the tip of the cone with the SUBTRACT command.
To create a cone: Draw > Modeling>Cone Command line>CONE


1.Choose Draw > Modeling > Cone from the main menu. 2.Specify the center of the base of the cone. 3.Specify the radius or diameter. 4.Specify the height.
Solid Cylinder
You can create cylinders defined by a circular base. The base of a cylinder is always parallel with the xy plane of the current UCS; the height of a cylinder is always parallel with the z axis. You can draw a circle and then use EXTRUDE to create a solid cylinder.

To create a cylinder: Draw > Modeling>Cylinder Command line>CYLINDER

1.Choose Draw > Modeling> Cylinder from the main menu. 2.Specify the center of the base of the cylinder. 3.Specify the radius or diameter. 4.Specify the height.
Sphere
The latitude lines of a sphere are always parallel with the xy plane of the current UCS; the central axis is always parallel with the z axis. You determine the size of a sphere by specifying either its radius or its diameter.

To create a sphere: Draw > Modeling>Sphere Command line>SPHERE
1.Choose Draw > Modeling > Sphere from the main menu. 2.Specify the center of the sphere. 3.Specify the radius or diameter.
Torus

A torus is constructed by revolving a circle about a line drawn in the plane of the circle and parallel with the z axis of the current UCS. You determine the size of a torus by specifying its overall diameter or radius and the diameter or radius of the tube (the circle being revolved).
To create a torus: Draw > Modeling>Torus Command line>TORUS
1.Choose Draw > Modeling > Torus from the main menu. 2.Specify the center of the whole torus. 3.Specify the radius or diameter of the whole torus. 4.Specify the radius or diameter of the body of the torus.
Pyramid
You can create a tetrahedron (three-sided pyramid) or a four-sided pyramid. The base of the pyramid is always parallel to the xy plane of the current UCS. You determine the size of the pyramid by specifying the base points and either the apex, the corners of the top surface, or the endpoints of the ridge.

To create a pyramid: Draw > Modeling>Pyramid Command line>PYRAMID
-
Choose Draw > Modeling > Pyramid from the main menu.
-
Specify the first point for the base of the pyramid.
-
Specify the second and third points.
-
In the prompt box, choose Tetrahedron.
-
Specify the apex of the tetrahedron.
Wedge
You can create three dimensional wedges consisting of five surface planes. You determine the size of the wedge by either specifying a second corner and the height; defining the wedge based on a cube having a given length; or specifying the length, width, and height.

To create a wedge: Draw > Modeling>Wedge Command line>WEDGE
1.Choose Draw > Modeling> Wedge from the main menu. 2.Specify the first corner of the base. 3.Specify the opposite corner of the base.4.Specify the height.
Solids Extrude
EXTRUDE command, extrudes the profiles of the selected object along the chosen path to create solids. The entities you can extrude are planar 3D faces, closed polylines, polygons, circles, ellipses, closed splines, donuts, and regions. You cannot extrude objects contained within a block or polylines that have crossing or self-intersecting segments.

To create an extruded solid: Draw > Modeling>Extrude Command line>EXTRUDE
1.Choose Draw >Modeling>Extrude from the main menu. 2.Select the object to extrude. 3.Select the extrusion path, or specify the height.
Solids Revolve
REVOLVE command revolves a 2D object to the specified certain angle to form solids. The revolving axis can be X, Y axis of current UCS as well as lines, polylines. Objects can be revolved are closed polylines, polygons, rectangles, circles, ellipses, regions and so on.
To create a revolved solid: Draw > Modeling>Revolve Command line>REVOLVE

1.Choose Draw > Modeling> Revolve from the main menu. 2.Select the object to revolve. 3.Do one of the following to define the axis of revolution: -Specify a start point and an end point. -Type o and press Enter to select an object. -Type x and press Enter to select the x axis. -Type y and press Enter to select the y axis. 4.Specify the angle of revolution.
Solid

With the Plane tool, you can draw rectangular, triangular, or quadrilateral areas filled with a solid color. The default method is to specify the corners of the plane. After you specify the first two corners, the plane is displayed as you specify the remaining corners. The program prompts you for the third point and then the fourth point.
To draw a quadrilateral plane:
1.Choose Draw > Modeling > Meshes> 2D Solid 2.Specify the first, second, third and fourth point. 6.Finish the command, press Enter.
Flatshot
With FLATSHOT command you can create a 2D representation of all 3D objects based on the current view.The edges of all 3D solids, surfaces, and meshes are projected line-of-sight onto a plane parallel to the viewing plane. The 2D representations of these edges are inserted as a block on the XY plane of the UCS. This block can be exploded for additional changes.


Flatshot dialog box
Destination: Controls where the flattened representation is created. Insert As New Block: Specifies to insert the flattened representation as a block in the current drawing. Replace Existing Block:Replaces an existing block in the drawing with the newly created block. Select Block: Closes the dialog box temporarily while you select the block you are replacing in the drawing. When you finish selecting the block, press Enter to re-display the Block Selected / No Block Selected:Indicates whether a block has been selected.

Export to a File:Saves the block to an external file. Foreground Lines:Contains controls for setting the color and linetype of lines that are not obscured in the flattened view. Color: Sets the color of lines that are not obscured in the flattened view. Linetype:Sets the linetype of lines that are not obscured in the flattened view. Obscured Lines: Controls whether lines that are obscured in the drawing are displayed in the flattened view, and sets the color and linetype of these obscured lines. Show:Controls whether obscured lines are shown in the flattened representation. When selected, the 2D flattened representation displays lines hidden by other objects. Color:Sets the color of lines that lie behind geometry in the flattened view. Linetype:Sets the linetype of lines that lie behind geometry in the flattened view. Include Tangential Lines:Creates silhouette edges for curved surfaces. Create:Creates the flattened view.
Creating Composite Solids
You can create composite three-dimensional solids by combining, subtracting, and finding the intersection of two or more solids. With UNION command, you can combine the total volume of two or more solids or two or more regions into a composite object.

To combine solids: Modify>Solid Editing>Union Command line>UNION
1.Choose Modify>Solid Editing> Union from the main menu. 2.Select the objects to combine.

To subtract solids: Modify>Solid Editing>Subtract Command line>SUBTRACT
1.Choose Modify>Solid Editing>Subtract from the main menu.
2.Select the objects to subtract from one another.

To intersect solids: Modify> Solid Editing>Intersect Command line>INTERSECT
1.Choose Modify >Solids Editing >Intersect from the main menu. 2.Select the objects to intersect.
POLYSOLID
The POLYSOLID command allows you to create 3D solid in a shape of a wall directly or by selecting existing polylines. A polysolid is drawn the same way you draw a polyline, which is created with continuous straight and curved segments.


After inputting the POLYSOLID command, you will get 4 options (Object, Width, Height, and Justification) in the command line and dynamic input box.
-
Type “Width” or “Height” to set width and height.
-
Type “Justify” to set justification (Left, Center, Right).
-
When you start drawing solid wall after clicking on your first point, it gives you 2 options (Arc, Undo) in the command line and dynamic input box. If you don’t input any of them, you can just continue drawing your lines.
-

If you type “Arc”, it can give you 3 options (Close, Direction, Line), you can draw the arc by 2 points or enter “Direction” to draw the arc by tangency direction.
-
You can also type “Close” to close your polysolids or type “Line” to change back to line again. If you type “Undo”, it will back to previous point.
-

If you type “Object” in dynamic input box or in command line, you can convert existing lines, 2D polylines, arcs, and circles into 3D solids with default height, width, and justification. This feature only allows select objects one by one.
PSOLWIDTH: System variable, sets the default width for the 3D polysolid.
PSOLHEIGHT: System variable, sets the default height for the 3D polysolid.
PLANESURF
You can input PLANESURF command or click Ribbon – Surface – Plan to create a planar surface by selecting closed objects or specifying the opposite corners of a rectangular surface. When the corners of the surface are specified by the command, you can create a surface parallel to the work plane.
SURFU / SURFV: System variable, sets the number of lines displayed on the surface
DELOBJ : System Variable, decides whether to delete defining objects.

SURFOFFSET

SURFOFFSET
You can input SURFOFFSET command to create a parallel surface at a specified distance from the original surface.
After selecting the surface and pressing enter, you will get 4 options (Flip direction, Both sides, Solid, Expression) in the command line and dynamic input box.
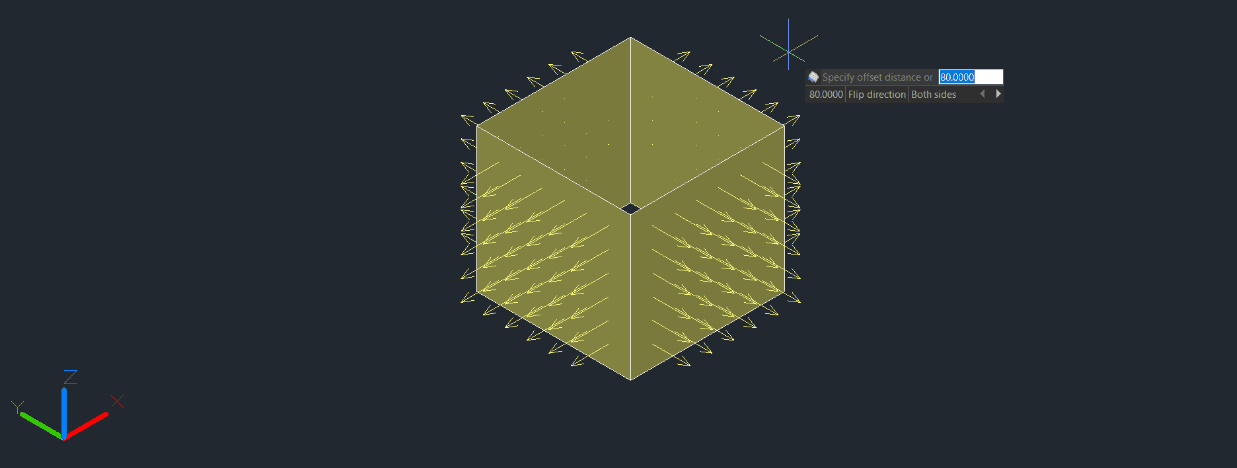
You can Offset the surface in one direction (the arrows will show on one side of the surface) by entering a distance or select the point on the drawing.
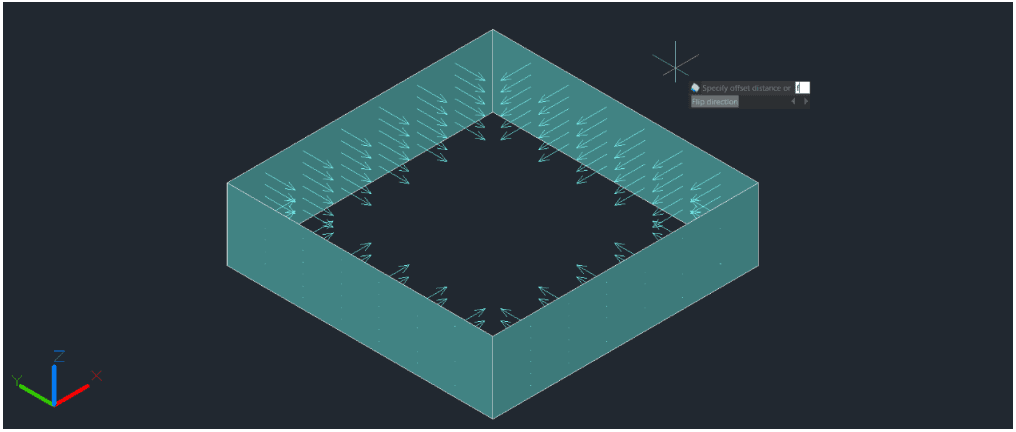
If you type “Flip direction”, the arrows will flip to another side.
- If you type “Both sides”, you can Offset the surface in both directions (the arrows will show on both sides of the surfaces)

- If you type “Solid”, you can Generate the surface to a solid after the offset

- If you type “Expression”, you can enter a formula or equation to specify the distance of the surface offset.

SURFACEASSOCIATICITY: System Variable, when the value is 1, Expression option will be displayed. This option does not update the offset distance default value the next time you enter the command.
SURFACEMODELINGMODE: System Variable, when the value is 1, the surface will be a NURBS surface.
CONVTOMESH
You can input CONVTOMESH command or click Ribbon- Mesh – Convert to MESH to convert eligible 3D objects into meshes, the objects will be smoothed at the same time in the conversion as well.

Eligible objects include: solids, closed polylines, regions, 3D face, 3D surfaces, polygon meshes.
When the 3D entities that are extruded, swept, lofted, and revolved with arcs are converted to meshes, and the number of faces and vertices after conversion cannot be displayed correctly
FACETERMESHTYPE: System Variable, controls the level of smoothness upon conversion (If the mesh type is not set to be optimized, the converted object is not smoothed).
DELOBJ : System Variable, decides whether to delete defining objects.
CONVTOSOLID

CONVTOSOLID
You can input the CONVTOSOLID command to convert eligible objects to 3D solids.
Eligible objects include:
-
3D meshes that completely enclose a volume
-
Surfaces that completely enclose a volume
-
Closed polylines and circles with a non-zero thickness property; wide polylines must have a uniform width
The Command has following limitations:
-
You can select one or more objects to convert to solid, if any object in your selection set is in invalid for the command, you will be prompted again to select the objects.
-
It’s not available to convert planar surfaces or regions with contiguous edges to 3D solid.
-
It’s not available to convert separate objects to 3D solid. If the surfaces enclose a watertight area, you can convert to a solid with the SURFSCULPT command.
SMOOTHMESHCONVERT: System Variable, only supports value 3. Smoothness and optimization effect won’t be supported in the version.
DELOBJ : System Variable, decides whether to delete defining objects.
CONVTOSURFACE

You can input the CONVTOSURFACE command or click Ribbon- Mesh – Convert to SURFACE to convert eligible objects into 3D surfaces.
Eligible objects include: 2D solids, 3D solids, Mesh objects, Planar 3D faces, Regions, Zero-width polylines with thickness, Polylines with global-width, Lines with thickness, Arcs with thickness, Closed plane curve.
SMOOTHMESHCONVERT: This System Variable only supports value 3. Smoothness and optimization effect won’t be supported in the version.
DEOBJ : System Variable, when sets the value to 0/3/-3, the defining objects won’t be deleted, when the value is -1/-2, there will be a two options for users to choose delete or not, when it is 1/2, the defining objects will be deleted.
CONVTONURBS
You can input CONVTONURBS command or click Ribbon- Surface – Convert to NURBS to convert solids and procedural surfaces to NURBS surfaces. You can also convert meshes to NURBS surfaces after converting them to a solid or surface by CONVTOSOLID or CONVTOSURFACE command.

There are a series of new functionalities for NURBS control vertices editing and display, such as
- SHOW CV: Shows control vertices. You can adjust the NURBS surfaces by clicking the control vertices, you will get 4 options (Base, Copy, Undo, Exit) in your command line and dynamic input box.

-
Base: Moves your control vertices according to the base point and second point you choose.
-
Copy: Copies a new NURBS surface and move it, the original surface won’t be deleted.
-
Undo: Cancels the previous step.
-

Exit: Stops adjusting control vertices.
-
HIDE CV: Hides control vertices.
-
ADD: Adds control vertices. After selecting the object, you will get 2 options (Knots, Direction) to add control vertices and set the position.
-
Knots: Turns off the display of control vertices and allows you to place a point directly on a surface. This option only displays if you select a surface; it does not display for splines.
-
Direction: Specifies whether to add control vertices in the U or V direction. This option only displays if you select a surface; it does not display for splines.
-
REMOVE: Removes control vertices. There are at least 2 control vertices in each direction.
DELOBJ : This System Variable decides whether to delete defining objects.
Point Cloud
GstarCAD 2025 supports point cloud file extensions (.rcp and .rcs) as attachment in a drawing. The point cloud is inserted at the specified coordinates, based on the location of the Insertion object snap. Users can apply object color and RGB scan colors to display point cloud data.

When users attach the Point Cloud data, the following options will be displayed in Attach Point Cloud dialog box:

-
Name: Identifies the point cloud file to attach.
-
Browse: Opens the Select Point Cloud dialog box, a standard file selection dialog box where you can find and select a point cloud file.

-
Path type:
-
Full path: Uses the full path of the specified file, including the root folder and all subfolders that contain the point cloud file.
-
Relative Path: Uses the file path relative to the current drawing file to reference the point cloud file.
-
No Path: Only uses the file name of the point cloud file for referencing. The file must be located in the same folder as the current drawing file.
-
Insert point: Specifies the location in the drawing where the base point of the point cloud will be attached.
-
Specify On-screen: Specifies the insertion point in the target drawing while you insert it.
-
X, Y, Z: Sets the coordinate values of the insertion point.
-
Scale: Specifies the scale factor for the inserted point cloud.
-
Specify On-screen: Specifies the relative scale of the point cloud as you attach it.
-
Scale: Sets the scale factor of the point cloud.
-
Rotation: Specifies the rotation angle for the inserted point cloud.
-
Specify On-Screen: Specifies the rotation angle of the point cloud by the pointing device.
-
Angle: Sets the rotation angle of the point cloud.
-
Other Options:
-
Use Geographic Location: Inserts the point cloud based on the geographic data in the point cloud file.
-
Lock Point Cloud: Controls whether an attached point cloud can be moved or rotated.
-
Zoom to Point Cloud: Zoom to the extents of the attached point cloud object automatically.
-
Show / Hide Details: Includes number of points, Point Cloud unit, and Point Cloud data.

Create Regions

You can convert a closed object into a two dimensional region. After you create a region, you can modify it using the various three dimensional tools. You can create regions from closed objects, such as polylines, polygons, circles, ellipses, closed splines, and donuts.
To create a region: Draw> Region Command line>REGION
1.Choose Draw > Region from the main menu. 2.Select the objects to create the region and press Enter.
Create Revision Cloud

REVCLOUD command creates or modifies a revision cloud You can create a new revision cloud by selecting two corner points or polygonal points, dragging your cursor or you can also convert an existing object such as a circle, ellipse ,polyline or spline to a revision cloud.
To create a revision cloud: Command line>REVCLOUD
Create Break Line
Creates a polyline and inserts the breakline symbol. To use your own block for the breakline symbol, make sure that the block contains two point objects on the Defpoints layer.

To create a revision cloud: Command line>BREAKLINE
1.Type BREAKLINE on the command line. 2.Specify first and second point for breakline. 3.Specify location for break symbol.
Create Wipeout
Wipeouts are created using existing polygons, closed zero-width polylines made up of only line segments, or new polylines that you draw while using the WIPEOUT command. Also you could use a circle object to be wipeout or even you can pick up a closed polyline object containing arcs. For example, you can explode and outline a block definition shape (car) then join it as polyline then wipeout this polyline and group it with the block definition and place it on your drawing as showing below.

To draw a wipeout: Draw>Wipeout Command line>WIPEOUT
1.Choose Draw > Wipeout from the main menu. 2.Specify the start point and endpoint of each segment. 3.After specifying the last endpoint, press Enter.


Create Table
The new Table function with TABLEDIT\TABLESTYLE\TABLEEXPORT command group are possible now to create and modify table as well as to define the format of table. It is possible to export the table to CVS file and open it on Microsoft Excel.
To draw table: Draw>Table Command line>Table
Insert Table Dialog Box
Input TABLE command and press ENTER, and "Insert Table" dialog box will be open.


Table Style: Choose a table style from within the current drawing from which to create a table. You can create a new table style by clicking the button next to the drop-down list.
Preview: Controls whether a preview displays. If you start from an empty table, the preview displays an example of the table style.

Insertion Behavior: Specifies the location of the table.
Specify Insertion Point: Specifies the location of the upper-left corner of the table. You can use the pointing device or enter coordinate values at the Command prompt. If the table style sets the direction of the table to read from the bottom up, the insertion point is the lower-left corner of the table.

Specify Window: Specifies a size and a location for the table. You can use the pointing device or enter coordinate values at the Command prompt. When this option is selected, the number of columns and rows and the column width and row height depend on the size of the window and the column and row settings.

Column & Row Settings: Set the number and size of columns and rows.
Columns Icon: Indicates columns.
Rows Icon: Indicates rows.

Columns: Specifies the number of columns. When the Specify Window option is selected and you specify a column width, the Automatic option is selected, and the number of columns is controlled by the width of the table. If a table style containing a starting table has been specified, then you can choose the number of additional columns you would like added to that starting table.

Column Width: Specifies the width of the columns. When the Specify Window option is selected and you specify the number of columns, the Auto option is selected, and the column width is controlled by the width of the table. The minimum column width is one character.

Rows: Specifies the number of rows. When the Specify Window option is selected and you specify a row height, the Automatic option is selected, and the number of rows is controlled by the height of the table. A table style with a title row and a header row has a minimum of three rows. The minimum row height is one line. If a table style containing a starting table has been specified, then you can choose the number of additional data rows you would like added to that starting table.
Row Height: Specifies the height of the rows in number of lines. The height of a line is based on the text height and the cell margin, which are both set in the table style. When the Specify Window option is selected and you specify the number of rows, the Auto option is selected, and the row height is controlled by the height of the table.

Set Cell Styles: For table styles that do not contain a starting table, specifies a cell style for rows in the new table.

First Row Cell Style: Specifies a cell style for the first row in the table. The Title cell style is used by default.
Second Row Cell Style: Specifies a cell style for the second row in the table. The Header cell style is used by default.
All Other Row Cell Styles: Specifies a cell style for all other rows in the table. The Data cell style is used by default.
Table Style Dialog Box
Current Table Style: Displays the name of the table style that is applied to tables you create.
Styles: Displays a list of table styles. The current style is highlighted.
List: Controls the contents of the Styles list.

Preview: Displays a preview image of the style that is selected in the Styles list.
Set Current :Sets the table style selected in the Styles list as the current style. All new tables are created using this table style.
New: Displays the Create New Table Style dialog box, in which you can define new table styles.
Modify: Displays the Modify Table Style dialog box, in which you can modify table styles.
Delete: Deletes the table style selected in the Styles list. A style that is being used in the drawing cannot be deleted.
Create New Table Style Dialog Box
Specifies a name for the new table style and specifies the existing table style on which the new table style will be based.

New Style Name: Names the new table style.
Start With: Specifies an existing table style whose settings are the default for the new table style.
Continue: Displays the New Table Style dialog box, in which you define the new table style.
New and Modify Table Style Dialog Boxes

New and Modify Table Style Dialog Boxes
Starting Table: Allows you to specify a table in your drawing to use as an example for formatting this table style. Once you select a table, you can specify the structure and contents you want copied from that table to the table style. With the Remove Table icon, you can remove a table from the current specified table style.
General Table Direction: Defines a new table style or modifies an existing table style. It sets the direction of a table.
Down: The title row and the column heads row are at the top of the table.
Up: The title row and the column heads row are at the bottom of the table.
Preview: Displays an example of the effect of the current table style settings.
Cell Styles: Defines a new cell style or modifies an existing cell style. You can create any number of cell styles.
Create Cell Styles Button: Launches the Create New Cell Style dialog box.
Manage Cell Styles Button: Launches the Manage Cell Styles dialog box.


General Tab
Properties
Fill Color: Specifies the background color of the cell.
Alignment: Sets justification and alignment for the text in the table cell.
Format: Sets data type and formatting for the Data, Column Heading, or Title rows in a table. Clicking this button displays the Table Cell Format dialog box, where you can further define formatting options.
Type: Specifies the cell style as either a tag or data.
Margins
Horizontal: Sets the distance between the text or block in the cell and the left and right cell borders.
Vertical: Sets the distance between the text or block in the cell and the top and bottom cell borders.
Merge cells on row/column creation: Merges any new row or column created with the current cell style into one cell. You can use this option to create a title row at the top of your table.

Text Tab
Text Style: Lists the available text styles.
Text Style Button: Displays the Text Style Dialog Box where you can create or modify text styles.
Text Height: Sets the text height.
Text Color: Specifies the color of the text. Choose Select Color at the bottom of the list to display the Select Color dialog box.
Text Angle: Sets the text angle. The default text angle is 0 degrees. You can enter any angle between -359 and +359 degrees.

Borders Tab
Lineweight: Sets the lineweight to be applied to the borders you specify by clicking a border button. If you use a heavy lineweight, you may have to increase the cell margins.
Linetype: Sets the linetype to be applied to the borders you specify. Choose Other to load a custom linetype.
Color: Sets the color to be applied to the borders you specify by clicking a border button.
Double Line: Displays table borders as double lines.
Spacing: Determines the spacing for double line borders.
Modify Objects
You can easily modify the size, shape, and location of objects. You can either, enter a command first and then select the objects to modify, or you can select the objects first and then enter a command to modify them.
Remove Objects
You can use ERASE command to delete objects, whatever the methods you use to select objects. To restore the deleted objects, use UNDO command. You can remove objects using one of the following methods: Delete objects with ERASE command, cut the selected objects to the clipboard, or press DELETE to remove the selected objects.
Copy Objects
You can duplicate objects within the current drawing. The default method is to create a selection set and then specify a base point, and a displacement point, for the copy. To copy objects at the specified distance, you can specify the distance directly when the Ortho Mode or Polar Tracking is on.

Create only one copy of object one time:
1.Choose Modify > Copy from the main menu. 2.Select the objects, and then press Enter. 3.On the command line, type O (mOde). 4.On the command line, type S (Single). 5.Specify the base and displacement point.
Create multiple copies for selected object one time:

1.Choose Modify > Copy from the main menu. 2.Select the objects, and then press Enter. 3.On the command line, type O (mOde). 4.On the command line, type M (Multiple). 5.Specify the base and displacement point of the first copy. 6.Specify the displacement point of the next copy. 7.To complete the command, press Enter.
Mirror Objects
You can specify a baseline to create a mirror image using MIRROR command. The mirror image is symmetrical with the original one. So if you want to create a symmetrical objects, you only need to draw a half one, then create a full one using MIRROR command. Besides picking start and end point to define mirror axis, you can also directly select objects as mirror axis like a line, polyline, a line of block or an external reference drawing.

To mirror objects:
1.Choose Modify > Mirror from the main menu. 2.Select the object, and then press Enter. 3.Specify the first and second point of the mirror line. 4.On the command line, if you want to retain the original objects, type N; if you want to delete the original objects, type Y.
Offset an Object
You can use the offset to copy selected objects and align them offset to the original objects at a specified distance. You can make offset objects using arcs, circles, ellipses, elliptical arcs, lines, two dimensional polylines, rays, and infinite lines.

To make an offset copy by specifying the distance:
1.Choose Modify > Offset from the main menu. 2.Specify the distance (select two points or enter a distance). 3.Select the object to offset. 4.Specify on which side of the object to place the parallel copy. 5.Press Enter to complete the command.

To make an offset copy passing through a point:
1.Choose Modify > Offset from the main menu. 2.On the command line, type T (Through). 3.Select the object to offset. 4.Specify the point for the object to pass through. 5.Press Enter to complete the command.
Create an Array of Objects
New array options are available to create copies of objects arranged in rectangular, polar, or path pattern. The new array is as a whole (dynamic block). It can be dynamically adjusted the number of ranks, spacing and other related parameters through Ribbon Panel, Properties and Grip.

To create a rectangular array:
1.In “2D Drafting” workspace, click “Home”>“Modify”>“Rectangular Array” in turn.
-
Select the object to be arrayed and press “ENTER”.
-
In the array preview, drag the grips to adjust the spacing and number of rows and columns.
You can also modify values in "Array" Ribbon .
To create a polar array:

1.In “2D Drafting” workspace, click “Home”>“Modify”>“Polar Array” in turn. 2.Select objects to array. 3.Specify center point of array (array preview will be showed). 4.Input “i” (items), and then input the number of items to array. 5.Input “a” (angle), and then input the fill angle.
You can also select grips to edit array.
To create a path array

The best way to use Path Array is to create them at first. And then you can use the tools or “Properties” of the Ribbon to modify them.
1.In “2D Drafting” workspace, click “Home”>“Modify”>“Path Array” in turn. 2.Select the object to array, and “ENTER” 3 Select an object (such as a line, a polyline, a 3D polyline, a spline, a helix, an arc, a circle or an ellipse) to be as a path to array. 4.Specify the way to distribute items along the path:
If you want to distribute items evenly throughout the path length, please click “Properties” panel in Ribbon >“Divide” in turn. If you want to distribute items at a specific distance, you can click “Properties”>“Measure” in turn. 5.Move the cursor along the path to adjust the items.
6.Press “ENTER” to finish Array.
Move Objects
You can move objects to a new place without changing the objects. You can perform MOVE command and then select object (1) to move; specify a base point (2) and Displacement point (3). The object is moved from point 2 to the point 3.

To move entities:

1.Choose Modify > Move from the main menu. 2.Select the objects, and then press Enter. 3.Specify the base and displacement point.
To move an object using grips:
1.Select the object. 2.Click a grip to select it. 3.Drag the object to where you want to relocate it and press Click to release.
Rotate Objects
You can rotate the selected objects around a specified point. You can specify the rotated angle by specifying a point on the drawing or entering the angle value directly. The direction that objects rotate depends on the value you enter is positive or negative.

To rotate objects:
1.Choose Modify > Rotate from the main menu. 2.Select the objects, and then press Enter. 3.Specify the base point and rotation angle.
To rotate a selection set in reference to an Absolute Angle:

1.Choose Modify > Rotate from the main menu. 2.Select the objects, and then press Enter. 3.Specify the base point. 4.On the command line, type R (Reference). 5.Specify the reference and new angle.
Align Objects
You can align objects with another through move or rotation with ALIGN command.

To align and object to other as reference:
1.Choose Modify >Align from the main menu. 2.Select the object, and then press Enter. 3.Specify the first source point. 4.Specify the destination point. 5.Press Enter to finish the command.
Scale Objects
You can use SCALE command to scale the proportionality of the selected objects. You can type a scale factor or specify a base point and distance to zoom objects. A scale factor that is greater than 1 enlarges the object; and a scale factor that is smaller than 1 shrinks the object.

To scale a selection set by a scale factor:
1.Choose Modify > Scale from the main menu. 2.Select the objects, and then press Enter. 3.Specify the base point. 4.Specify the scale factor.
Lengthen Objects
You can change the length of entities or the included angle of arcs. The results are similar to extending and trimming.This command does not affect the closed entities.

To change the length of an object by dragging:
1.On the command line type LENGTHEN. 2.On the command line, type DY (DYnamic). 3.Select the object you want to change. 4.Specify the new endpoint or included angle.
Stretch Objects
When stretching objects, you have to specify a base point and displacement point. You should use crossing selection to select the desired objects. With using grip edition, you can also stretch objects.

To stretch an object:
1.Choose Modify > Stretch from the main menu. 2.Select the objects using either a crossing window or a crossing polygon, and then press Enter. 3.Specify the base point. 4.Specify the second point of displacement.

To stretch an object using grips:
1.Select the object. 2.Click a grip to activate it. 3.Drag the grip. 4.Click to release.
Trim Objects

You can clip, or trim, objects so they end at one or more implied cutting edges defined by other objects. You can trim arcs, circles, lines, unclosed polylines, and rays.
To trim an object:
1.Choose Modify > Trim from the main menu. 2.Select one or more cutting edges, and then press Enter. 3.Select the object to trim. 4.Press Enter to complete the command.

To trim several objects using the fence selection method:
1.Choose Modify > Trim from the main menu. 2.Select one or more cutting edges, and then press Enter. 3.On the command line, type F (Fence). 4.Specify the first point of the fence. 5.Specify the second point of the fence. 6.Press Enter to complete the command.
Extend Objects

You can extend objects so that they end at a boundary defined by other objects. You can extend arcs, lines, two-dimensional polylines, and rays. Arcs, circles, ellipses, lines, splines, polylines, rays, infinite lines, and viewports on a Layout tab can act as boundary edges.
To extend an object:
1.Choose Modify > Extend from the main menu. 2.Select one or more objects as boundary edges, and then press Enter. 3.Select the object to extend, and press Enter to finish the command.

To extend an object to an implied boundary:
1.Choose Modify > Extend from the main menu. 2.Select one or more boundary edges, and then press Enter. 3.On the command line, type E (Edge). 4.On the command line, type E (Extend). 5.Select the object to extend, and press Enter to finish.

To extend several objects using the fence selection method:
1.Choose Modify > Extend from the main menu. 2.Select one or more boundary edges, and then press Enter. 3.On the command line, type F (Fence). 4.Specify the first and second point of the fence. 5.Press Enter to complete the command.
Create Breaks

You can break arcs, circles, ellipses, lines, polylines, rays, and infinite lines. When breaking entities, you must specify two points for the break. By default, the point you use to select the entity becomes the first break point; however, you can use the first break point option to select a break point different from the one that selects the entity.
To break an object:
1.Choose Modify > Break from the main menu. 2.Select the object. 3.Specify the second break point.

To select an object and then specify the two break points:
1.Choose Modify > Break from the main menu. 2.Select the object. 3.On the command line, type F (First point). 4.Specify the first and second break point.
Create Chamfers
You can connect two nonparallel objects by extending or trimming them and then joining them with a line to create a beveled edge. You can chamfer lines, polylines, rays, and infinite lines. When creating a chamfer, you can specify how far to trim the objects back from their intersection (distance distance method), or you can specify the length of the chamfer and the angle it forms along the first object (distance angle method).

When chamfering a polyline, you can chamfer multiple segments between two selected polyline segments, or you can chamfer the entire polyline.
To chamfer two objects using the distance-distance method:
1.Choose Modify > Chamfer from the main menu. 2.On the command line, type D (Distance). 3.Specify the first chamfer distance. 4.Specify the second chamfer distance. 5.Select the first object to chamfer. 6.Select the second object to chamfer.

To chamfer two objects using the distance-angle method:
1.Choose Modify > Chamfer from the main menu. 2.On the command line, type A (Angle). 3.Specify chamfer length on the first line. 4.Specify chamfer angle from the first line. 5.Select the first object to chamfer. 6.Select the second object to chamfer.
To chamfer selected vertices in a polyline:

1.Choose Modify > Chamfer from the main menu. 2.Select one polyline segment where you want to begin the chamfer. 3.Select the other polyline segment where you want to end the chamfer.

To chamfer all vertices in a polyline:
1.Choose Modify > Chamfer from the main menu. 2.On the command line, type P (Polyline). 3.Select the polyline.
Create Fillets
You can create a fillet using FILLET command. This command can apply to the objects such as arcs, circles, ellipses, lines, polylines, rays, splines or construction lines. A fillet is an arc that connects two objects smoothly and has a specified radius. An inside corner is called a fillet; an outside corner is called a round. Before creating fillets, you should ensure the distance between each vertex is long enough to accommodate the fillet radius in order to insert a fillet arc. When the fillet radius is set to 0, no fillet arcs are inserted. If two polyline segments are separated by one arc segments, system deletes this arc segment and extends the lines to intersect with each other.

To fillet two objects:
1.Choose Modify > Fillet from the main menu. 2.On the command line, type R (Radius). 3.Specify the fillet radius. 4.Select the first and second object.

To fillet an entire polyline:
1.Choose Modify > Fillet from the main menu. 2.On the command line, type P (Polyline). 3.Select the polyline.

To fillet selected vertices in a polyline:
1.Choose Modify > Fillet from the main menu. 2.Select one polyline segment where you want to begin the fillet. 3.Select the other polyline segment where you want to end the fillet.
Trim and Extend Filleted Objects

Trim and Extend Filleted Objects
While performing fillet, you can select Trim option to decide whether the selected edges are extended to the endpoints of fillet arcs. By default, all objects except of circles, ellipses, closed polylines and splines are trimmed or extended when performing filleting.
Fillet Line and Polyline Combinations

Fillet Line and Polyline Combinations
If the objects to fillet are a line and a polyline, the line or its extension must be intersecting with one of the polyline segments. With Trim option on, the filleted objects join with the filleted arc to form a new polyline.
Fillet Parallel Lines

Fillet Parallel Lines
You can fillet parallel lines, rays, and infinite lines. The first entity must be a line or ray, the second entity can be a line, ray, or infinite line. The diameter of the fillet arc is always equal to the distance between the parallel entities. The current fillet radius is ignored.
Invert Fillet

Invert Fillet
Invert Fillet has a very wide range of usage particularly in construction and furniture industry. The FILLET command now offers a new option called Invert. You can create a reverse fillet by this option.
Disassociate Compound Objects

You can convert a complex entity, such as a block or polyline, from a single entity into its component parts. Exploding a polyline, rectangle, donut, polygon, dimension, or leader reduces it to a collection of individual line and arc entities that you can then modify individually. Blocks are converted to the individual entities, possibly including other, nested blocks that composed the original entity.

With the following exceptions, exploding an entity usually has no visible effect on a drawing:
-If the original polyline had a width, the width information is lost when you explode it. -If you explode a block containing attributes, the attributes are lost, but the original attribute definitions are retained. -Colors, linetypes, lineweights, and print styles assigned BYBLOCK may be different after exploding an entity, because they will adopt the default color, linetype, lineweight, and print style until inserted into another block.
Modify Polylines
Objects such as rectangles, polygons, and donuts, as well as three dimensional objects such as pyramids, cylinders, and spheres, are all editable polylines. To modify a polyline, perform PEDIT command. The available options vary depending on whether the selected polyline is a two dimensional or three dimensional object. If the selected object is not a polyline, the Edit Polyline tool provides the option of turning it into one. You can convert only arcs and lines into polylines. If several arcs or lines are joined endpoint to endpoint, they can all be selected and turned into one polyline.

Modify Multilines

You can use the methods such as common editing commands, a multiline editing command and multiline styles to edit multilines or their elements. You can use MLEDIT command to add or delete vertices for a multiline, to control the way two multilines intersected (cross and T shape that can be closed, open or merged), to add multiline style or set multilines from the existing multiline style, such as the number of elements, color, linetype, lineweight and the offset of each element.
Clip
The new CLIP command clips a block, external reference, image, viewport, and underlay (PDF or DGN) to a specified boundary. It can be used to replace XCLIP, IMAGECLIP, VPCLIP, PDFCLIP, DGNCLIP commands.
Add selected
You can use this function to create a new object of the same type and properties (such as colors, layers, lineweight, linetype and scale factor) as selected object but with different geometric values.
For example, creating objects based on selected circles uses the general properties of the circle, such as colors and layers, but prompt you to enter the center and radius of the new circle.
Steps to use ADDSELECTED
-
Select the object which the new object bases on.
-
Right-click and select "Add Selected".
-
Create an object similar to the selected object according to the prompts.
Multiple
Executes a command repetitively, avoiding press enter or space bar key. Because this command only repeats command names, all parameters must be specified each time. If we want to draw more than one circle, you can enter MULTIPLE, knock down “ENTER”, and then enter the CIRCLE, “ENTER”, you can draw a circle without the need to press the call to repeat the circle of the order in the process.
Set by layer
Changes the property overrides of the selected objects to ByLayer including color, linetype, lineweight, and materials.
MKSHAPE Command
The MKSHAPE command creates a shape definition based on selected objects. You can create custom linetypes easily. If you create a shape that exceeds 2200 bytes of data, MKSHAPE creates complex geometry shapes to form a single shape.
-
Create a polyline object like a line, rectangle, circle or a closed object.
-
Type MKSHAPE command to save a .shp file with a proper name for your shape.

-
Enter the name of the shape and input a resolution value (lower value input equals polyline shape degraded, higher value input equals similar shape as original polyline selected).
-
Specify an insertion point in drawing area, select the polyline created and press Enter.
-
If you want to insert the created new shape, execute SHAPE command and input its name.

- Specify an insertion point, scale and rotation.
Notes and Labels
Create Text
Create text, multiline text (mtext) and text that includes one or more leader lines.
Single-Line Text
You can use TEXT command to create a single or multiline text. Each line text is an independent object which can be modified. Before typing text, you can specify the text style and the way to align at the prompt of creating text.
Press ENTER if you have typed some characters, and then the command line prompts to input characters for the next row of text. While creating single line text, you are also enabled to extend or compress certain single line text object in specified space to meet with your need by means of selecting Align or Fit option from the TEXT command line prompt.
To create text:

1.Choose Draw > Text > Single Line Text from the main menu. 2.Specify the start point for the text. 3.Specify the height of the text. 4.Specify the text rotation angle. 5.Type the text, and then press Enter at the end of each new line. 6.To complete the command, press Enter again.

To specify the line text alignment:
1.Choose Draw > Text > Single Line Text from the main menu. 2.On the command line, type J (Justify) and press ENTER. 3.Type an alignment option BR to align text at its bottom-right corner. 4.Type the text, and then press Enter at the end of each new line. 5.To complete the command, press Enter again.
Multiline Text

Multiline text consists of one or more lines of text or paragraphs that fit within a boundary width that you specify. When you create multiline text, you first determine the paragraph's boundary width by specifying the opposite corners of a rectangle. The multiline text automatically wraps so that it fits within this rectangle. After defining the text frame, the system opens the In-Place Text Editor, which is comprised of a text frame and the Text Formatting toolbar. You can type text in the text frame and change the style from the Text Formatting toolbar.
To create multiline text:
1.Choose Draw > Text > Multiline Text from the main menu. 2.Select the first and second corner of the text area. 3.In the Multiline Text window, type the text you want. 4.To create paragraphs, press Enter and continue typing.
Remark: Other text features please refer to the express tool guide.

On the toolbar, make format changes as follows:
1.To change the font of the selected text, select a font from the list. 2.To change the height of the selected text, enter a new value in the Height box.3.To apply color to the selected text, choose a color from the Color list. 4.Click OK on the toolbar or Press <Ctrl + Enter>

Justify Multiline Text: You can specify the attachment point at the top left, top center, top right, middle left, middle center, middle right, bottom left, bottom center, or bottom right. The multiline text can flow left to right, right to left, top to bottom, or bottom to top.

Format Characters within Multiline Text: During creating multiline text, you can assign a new value to the selected objects to overlap the default setting. You can specify underlines, bold, color and fonts for a single or multiple characters, or different text height.


Indent Multiline Text and Use Tabs: You can control the appearance of text objects and create a list by specifying the tap stops and indenting text. The arrowheads on the ruler are used to define the indent of text (first line and paragraph).
Specify the Line Spacing: The line spacing of multiline texts is the distance between the baseline of one line of text and the baseline of the next line of text. You can right-click in the textbox and choose Paragraph to specify the desired line space when the cursor stays on the text frame.

Create Stacked Characters: Stacked text is text or fraction applied to mark tolerance or measure units. Before creating stacked text, you have to use special characters to indicate the stacked place for the selected text. The following contents present the special characters and illustrate how to create stacked text:
-Slash (/): Stacks text vertically and separates them with a horizontal line. -Pound sign (#): Stacks text diagonally and separates them with a diagonal line.-Carat (^): Creates a tolerance stack, which is stacked vertically as well as not separated by a line. You can also use Stack button on the toolbar to create stacked text.
Work with Text Styles
The text style is applied to the text objects. You can use text style to control the text font, size, angle, direction and other features. By default, the current text style is STANDARD, and you have to make other text styles current when you want to apply them. The STANDARD text style has the following default properties:


To create a text style:
1.Choose Format > Text Style from the main menu. 2.Click New, type a new text style name, and then click OK. 3.Under Text Measurements, specify the Text Height, Width Factor, and Oblique Angle. 4.Under Text Font, select the name, style, you want to use. 5.Click Apply, and then click OK.
Create Leader

Create Leader
Leaders
A leader is a line or spline with arrowhead at one end, and annotations (Mtext, blocks as well as tolerance) at the other end. Generally, you place an arrowhead at the first point. An annotation, created as dimension text, is placed immediately adjacent to the last point.
To create a leader and an annotation:
1.Choose Dimension > Leader from the main menu. 2.Specify the starting point of the leader. 3.Specify the endpoint of the leader line segment. 4.Specify additional leader line segment endpoints. 5.After you specify the last endpoint, press Enter. 6.Type the annotation, and press Enter to enter the next line of annotation text. 7.Press ENTER to complete the command.
Mleader
Multileader is used to attach annotation to multiple leader lines. Multileader could be used to give additional information or special instruction in a point or specific area on your drawing .It also has more capabilities like using multiline text or blocks as leader content in our drawing. This version supports the complete multileader set options like Add Leader, Remove Leader, Align and Collect.

Modify Text
Change Text
All of text objects can be moved, rotated, deleted and copied, just as like other objects. You can change the properties at the Properties panel. You have two methods to modify single-line text:
-To modify only the content of text, use DDEDIT command. -To change text style, location, size and content, use PROPERTIES command to open Properties palette, from which, you can make the relevant settings.
To edit single or multiline text:

1.Type DDEDIT and then press Enter. 2.Select the single line or multiline text. 3.If select the single line text, the Edit Text box will pop up, edit the text and then press Enter. 4.If select the multiline text, the In-Place Text Editor will pop, edit the text according as you need.


To change single or multiline text properties:
1.Select a single line or multiline text object. 2.Right-click the selected object and then click Properties on the shortcut menu. 3.In the Properties palette, enter any new text in the Text Contents, and then change formatting and other properties as needed.4.You can also do double-click on the multiline text to open the In-Place Text Editor, from which, you can modify the contents and formats of text.


Dimensions and Tolerances

Dimensions indicate the measurement values of objects (e.g. length or width), distance or angles among objects, or the distance between feature point and the specified origin. You can create five basic types of dimensions: linear, angular, radial, diametral and ordinate. Dimensions have several distinct elements: dimension text, dimension lines, arrowheads, and extension lines.
1.Dimension text: A character string that usually indicates the measurement value, includes prefixes, suffixes, tolerances, etc.
2.Dimension line: Indicates the direction and extent of a dimension. For linear dimensions, it displays as a line, for angular dimensions, it displays as an arc segment.
3.Arrowhead: Usually displayed at both end of the dimension line. You can specify various sizes and shapes for arrowheads or tick marks.
4.Extension lines: Extend from the object to the dimension line, in order to define dimension ranges.
Create Dimensions
You can create dimensions by selecting the entity to dimension and specifying the dimension line location, or by specifying the extension line origins and the dimension line location.
Horizontal and Vertical Dimensions

Horizontal and Vertical Dimensions
As you create linear dimensions, the system automatically applies a horizontal or vertical dimension depending on the specified extension line origins or the location where you select an object. However, you can create a dimension by specifying it be horizontal or vertical.
To create a horizontal or vertical dimension:
1.Choose Dimension > Linear from the main menu. 2.Press Enter, and then select the object to dimension. Or, you can specify the first and second extension line origins. 3.Specify the dimension line location.
Create Aligned Dimensions

Create Aligned Dimensions
In the aligned dimensions, the dimension line is parallel to the line passing through the extension line origins. The aligned dimension is also parallel to the objects you specify. The system creates the extension lines automatically.
To create an aligned dimension:
1.Choose Dimension > Aligned from the main menu. 2.Press Enter, and then select the object to dimension. Or, you can specify the first and second extension line origins. 3.Specify the dimension line location.
Create Baseline and Continued Dimensions
Both baseline and continued dimensions are multiple linear dimensions. Baseline dimensions are measured from the same baseline and continued dimensions are placed end to end. Before creating either baseline or continued dimension, you have to create a linear, aligned, or angular dimension.

To create a linear baseline dimension:
1.Choose Dimension > Baseline from the main menu. 2.Specify a second extension line origin3.Select the next extension line origin. 4.Continue selecting extension line origins as required. 5.To end the command, press Enter twice.
To create a linear continued dimension:

1.Choose Dimension > Continue from the main menu. 2.To select a starting dimension, press Enter. 3.Select the next extension line origin, and then press Enter. Or press Enter, and then select an existing dimension to continue.5.To add continued dimensions, continue selecting extension line origins. 6.To end the command, press Enter twice.

Create Rotated Dimensions

You can create rotated dimensions at a rotated angle you specify using DIMLINEAR Rotated option. An example of a rotated dimension is shown in the following illustration. In this illustration, the specified angle of the rotated dimension is equal to the angle of the slot.
Create Angular Dimensions
Angular dimensions are used to measure the angle between lines or three points. You can dimension objects including circles, arcs, and lines. When you create the angular dimension, you can modify the text contend and alignment before placing the dimension line.
To dimension an angle between two lines:
1.Choose Dimension > Angular from the main menu. 2.Select one line. 3.Select the other line. 4.Specify the dimension line location.

To dimension an angle encompassed by an arc:
1.Choose Dimension > Angular from the main menu. 2.Select the arc. 3.Specify the dimension arc location.
Create Radial Dimensions

You can create radial dimensions for circles or arcs to measure their radial. The radial dimension is a line with an arrowhead that points to a circle or arc.
To create a radial dimension:
1.Choose Dimension > Radius from the main menu. 2.Select the arc or circle. 3.Specify the dimension line location.
Jogged Dimension

Jogged dimension is namely jogged radius dimension, which is also called "scaled radius dimension". User can specify center position to place the origin of dimension for replacing center point of circle or arc within radius dimension. DIMJOGGED command is useful for creating dimensions in case that the center of circle or arc to be dimensioned is located outside the layout and can't be displayed in its actual position either.
To create a jogged radius dimension:
1.Choose Dimension > Jogged from the main menu. 2.Select a circle or an arc. 3.Select center position as the dimension origin. 4.Specify a point to position the jog symbol.
Create Diameter Dimensions
You can create diameter dimensions for circles or arcs to measure their diameters. Creating diameter dimensions resembles creating radial dimensions. You can create various diameter dimensions based on the location and size of circles or arc, and the settings of the dimension style.

To create a diameter dimension:
1.Choose Dimension > Diameter from the main menu. 2.Select the arc or circle. 3.Specify the dimension line location.
Create Ordinate Dimensions

Ordinate dimensions are used to measure the perpendicular distance from an origin point called the datum to a feature, such as a hole in a part. Ordinate dimensions are comprised of a leader line with an X or Y value, and leaders are drawn along the orthographic direction at the current UCS.
To create an ordinate dimension:
1.Choose Dimension > Ordinate from the main menu. 2.Select the point for an ordinate dimension. 3.Specify the ordinate leader endpoint.
Create Quick Dimension
Creates or edits a series of dimensions quickly by typing QDIM command.

To create a quick dimension:
1.Choose Dimension > Quick Dimension from the main menu. 2.Select the geometry to dimension, and then press Enter. 3.On the command line, it will display "Specify dimension line position, or[Continuous/Staggered/Baseline/Ordinate/Radius/Diameter/datumPoint/Edit/seTtings] <Continuous>:".You can perform the operation as desired. The default is Continuous.
Create Arc Length Dimension

Create Arc Length Dimension
Arc length dimension is available for measuring the arc length of arc or polyline arc segment. GstarCAD creates arc length dimension by specifying extension line position directly after selecting arc by default. And use an arc symbol as arc length dimension, which is differing from linear dimension and angular dimension.
To create an arc length dimension:
1.Choose Dimension > Arc Length from the main menu. 2.Select an arc or polyline arc segment. 3.Specify a point to position the arc length dimension.
DIMREASSOCIATE

DIMREASSOCIATE
You can input DIMREASSOCIATE command to associate or reassociate selected dimensions to objects or points on objects.

After enabling the DIMREASSOCIATE command, you will be prompted to choose associating particular dimension objects or associating all disassociated objects in the drawing one by one.
If you select Disassociate option
All of dimensions that have any disassociated defining point with geometries in the drawing will be selected to associate or reassociate one by one. You can press ‘Esc’ to stop the command, but associations you have made will be kept.
If you select any dimension objects
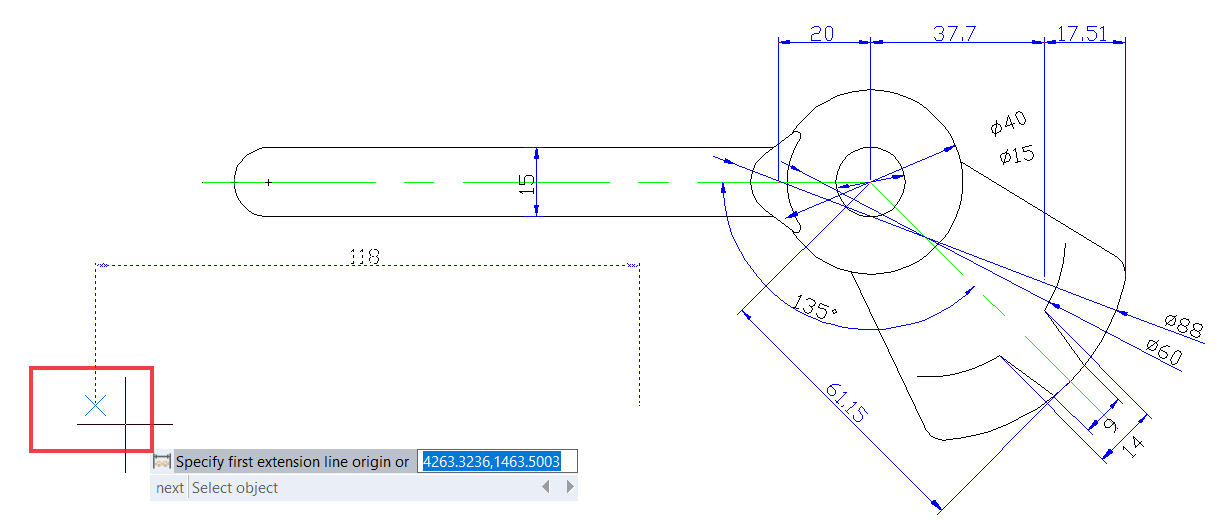
When the defining point of selected dimension object doesn’t associate with the geometry, the X mark is displayed.
- When the defining point of the selected dimension object associates with the geometry, the ⊠ mark is displayed.

-If you press Enter or select ‘Next’ option, you are able to skip to the next extension-line origin point.'
-If you select ‘Select object’ option, you are able to select a geometric object to associate with the dimension.
-If you press ‘Esc’, you will stop the command, but associations you have made will be kept.
Use Dimension Styles
You can control the appearance of dimensions by changing settings to help maintain dimensioning standards, you can store these settings in dimension styles.
Dimension Styles
You can create, save, restore, and delete named dimension styles. Dimension styles provide a way for you to change various settings that control the appearance of dimensions. You can change the following settings:
-Extension lines, dimension lines, arrowheads, center marks or lines, and the offsets between them. -The positioning of the parts of the dimension in relation to one another and the orientation of the dimension text. -The content and appearance of the dimension text and units of the dimension value.

To create a dimension style:
1.Choose Dimension > Style from the main menu. 2.In the Dimension Style Manager dialog box, click New. 3.Type the name of the new dimension style, and choose which style started with and what kind of dimension used for. Then click Continue. 5.In the New Dimension Style dialog box, change the dimension settings as necessary. Repeat this step for each tab, as needed. 6.To end the command, click OK.


To rename a dimension style:
1.Choose Dimension > Style from the main menu. 2.In the Styles list do one of the following: -Double click the required style. -Right click on the required style name, and then choose Rename. 3.Type the new name. 4.Click Close to exit.

To delete a named dimension style
1.Choose Dimension > Style from the main menu. 2.In the Styles list, right click on the required style name, and then choose Delete. 3.Click Close to close.

To display information about the current style:
1.Choose Dimension > Style from the main menu. 2.In the Dimension Style Manager dialog box, click Compare. 3.In the Compare Dimension Style dialog box, choose the same dimension style from the Compare and With pulldown list. All properties for specified dimension style will be displayed. 4.If you want to know the different information between two styles, choose one style in the Compare box, choose the other in the With box, and then you will see difference in the following tab. 5.Click Close to close.
Modify Dimension Lines

Modify Dimension Lines
On the Line tab of the Modify Dimension Style dialog box, you can set the color of dimension lines, lineweight, ticks beyond extend line, baseline spacing, and visibility.
Modify Extension Lines

Extension lines have the following properties: color, lineweight, distance beyond extension lines, offset from start of extension lines, and visibility. You can set these properties on the Line tab of the Modify Dimension Style box: -The distance beyond extension lines means that how far the extension lines extend beyond the dimension line. -Start offset is the distance between the extension line origin and the start of the extension line, also called extension origin offset.
Choose Dimension Arrowheads
You can control the appearance and size of arrowheads or hook marks placed at the ends of dimension lines. You can specify different arrowheads for both ends of a dimension or leader lines. The First arrow is toward the first extension line; The Second arrow is toward the second extension line.
To choose an arrowhead:

1.Choose Dimension > Style from the main menu. 2.In the Dimension Style Manager dialog box, select the style you want to change and click Modify button. 3.In the Modify Dimension Style dialog box, click the Symbols and Arrows tab. 4.Make your selections under the Arrowheads. 5.Click OK and then choose CLOSE to exit.
Fit Dimension Text within Extension Lines
When there is no enough space between extension lines to accept both of dimension text and arrowheads, you have to adjust one or both of their placement. By default, the system fits them best depending on the available space. You can specify other methods to place them on the Adjust tab of the Modify Dimension Style dialog box.
To format dimensions:
1.Choose Dimension > Style. 2.In the Dimension Style Manager dialog box, select the style you wish to change and choose Modify. 3.In the Modify Dimension Style dialog box, click the Adjust tab. 4.Under Fit Options and Text Placement, select an option.5.Click OK and choose Close to exit.
Fit Diameter Dimension Text

You can create various diameter dimensions based on text placement, fit options and the selection of "Always keep text between ext lines" option on the Adjust tab.

Align Dimension Text

Align Dimension Text
Whether the text is inside or outside the extension line, it has no effect on the justification of dimension text. You can choose whether the text is align with the dimension lines or remains horizontal.
To align dimension text with the dimension line:
1.Choose Dimension > Style. 2.In the Dimension Style Manager dialog box, select the style you wish to change and choose Modify. 3.In the Modify Dimension Style dialog box, click the Text tab. 4.Make your selections. 5.Click OK and choose Close to exit.
Position Dimension Text Vertically

Position Dimension Text Vertically
The vertical text placement is the position of the text relative to the dimension. You can place text above, below, or centered within the dimension line, or use the JIS dimensions.
Position Dimension Text Horizontally
The position of text along the horizon is relation to the extension lines. The settings include Centered, At Ext Line 1, At Ext Line 2, Over Ext Line1, and Over Ext Line2.

Dimension Units
You can determine the appearance and format of the primary and alternate dimension units. You can set the primary units for linear and angular dimensions, including unit format, numeric precision and so on. These settings control the display of dimension values.
To round off dimensions:
1.Choose Dimension > Style from the main menu. 2.In the Dimension Style Manager dialog box, select the style you wish to change and choose Modify. 3.In the Modify Dimension Style dialog box, click the Primary Units tab. 4.In the Linear Dimensions and Angular Dimensions fields, type or select the nearest value to which you want to round off dimensions. 5.Click OK and choose Close to exit.
Alternate Units
You can create a dimension in two systems of measurement simultaneously in a drawing. This feature is helpful when you want to add feet and inches dimensions in a drawing created using metric units. The alternative units appear in a square brackets ([]) in the dimension text. Alternative units can be applied to linear dimensions only.The precision for alternate units determines the number of decimal places.

To create an alternate dimension:
1.Choose Dimension > Style. 2.In the Dimension Style Manager dialog box, select the style you wish to change and choose Modify. 3.In the Modify Dimension Style dialog box, click the Alternate Units tab. 4.Click the Display Alternate Units check box. 5.Make your selections. 6.Click OK and choose Close to exit.
Display Lateral Tolerances
Lateral tolerance represents a value that the amount a measured distance can vary. You can control the degree of accuracy needed for a future by specifying tolerances in manufacturing. These dimension tolerances indicate the largest and smallest permissible size. You can also apply geometric tolerances to indicate deviations of form, profile, location, orientation, and runout.
Deviation tolerances represent with the plus and minus values that are appended to the dimension values. If the deviation tolerances are equal, the ± signs precede them and they are known as symmetrical. Otherwise, the plus value locates above the minus value.
The vertical placement of tolerance values that is relative to the main dimension text can be specified. For example, you can align the tolerances with the top, middle, or bottom of the dimension text.

Set the Scale for Dimensions
Setting dimension scale depends on the method you use to lay out and plot drawings. Dimension scale has effects on the size of dimension geometry relative to the objects in the drawing. In addition to text height and arrowhead size, dimension scale affects offsets in dimension as well, such as the extension line origin offset. When you create dimensions, it's recommended to set the size and offset to values that represent their actual plotted size. However, the tolerances, measured lengths, coordinates, and angles cannot be applied to the overall scale factor. The method of creating dimensions in a drawing layout is shown as follows:
-Dimension in model space for plotting in model space. If you want to create dimensions that are scaled correctly for plotting, you have to set the system variable DIMSCALE to the inverse of the desired plot scale. For example, if the plot scale is 1/4, you have to set DIMSCALE to 4.
-Dimension in model space for plotting in paper space. If you want to create dimensions that are scaled automatically for display in a paper space layout, you have to set the DIMSCALE to 0. This method is useful when you encounter the following situations: the dimensions in a drawing need to be referenced by other drawings (xrefs); when you create isometric dimensions in 3D isometric views. To prevent the dimensions in one layout viewport from being displayed in other layout viewports, it's recommended to create a dimensioning layer for each layout viewport that is frozen in all other layout viewports.
-Dimension in layouts. You can create dimensions in paper space by selecting model space objects or by specifying object snap locations on model space objects. The dimensions created in a paper space layout do not need additional scaling: there is no need to change the default value of DIMLFAC and DIMSCALE.
Modify Existing Dimensions
You can modify all components of the existing dimension objects in a drawing either individually or by using dimension styles.
Modify Dimension Style

Modify Dimension Style
You can modify all of properties of the existing dimension objects in a drawing using dimension styles. You can also create a dimension style override to temporarily change a dimensioning system variable without changing the current dimension style. If a dimension style is changed, the dimension associated with that dimension style updates automatically.
Make Dimensions Oblique

Make Dimensions Oblique
Extension lines are normally created at a perpendicular angle to the dimension line. You can change the angle of the extension lines, however, so that they tilt relative to the dimension line.
To make oblique extension lines:
1.Choose Dimension > Oblique from the main menu. 2.Select the linear dimension, and then press Enter. 3.Type the obliquing angle, and then press Enter.
Remark: To align the oblique angle if you don't know the exact measurement, use snaps to pick two points on the entity.
Dimension Jogged Linear

Dimension Jogged Linear
The DIMJOGLINE command is available for adding or removing jog symbol for linear dimensions. The jog symbol is default to be placed at the center point between first extension line and text. To relocate jog symbol, you can adjust the position of dimension text or specify new position to locate jog after reselecting dimension.
To add a jog to linear dimension:
1.Choose Dimension > Jogged Linear from the main menu. 2.Select a linear dimension. 3.Specify a point on the dimension line to determine the jog symbol, or press ENTER directly to position the jog symbol in default place.
Dimension Inspection

Dimension Inspection
Dimension inspection is created to transmit the frequency of inspecting the part being dimensioned, the dimension value and parts tolerance are ensured to be within specified range. Dimension inspection is composed by a frame and internal text and contains utmost three kinds of information field: inspection tag, dimension value and inspection rate.
Inspection tag, used for mark the text of dimension inspection is located at the left side within the inspection frame. Dimension value is the value before adding dimension inspection, which is located at the central part of the inspection dimension including tolerance, text and measurement value. Inspection rate is expressed by percentage, which is located at the right side within the inspection frame, indicates required frequency of the part being created.
To create an inspection dimension:
1.Choose Dimension > Inspect from the main menu. 2.In the Inspection Dimension dialog box, click Select Dimensions button. 3.Select dimensions to add dimension inspection, and then press ENTER to finish selection and return to the dialog box.4.Select a shape for frame from the Shape option.5.Click Label option to input label in the text box.6.Click Inspection Rate option to input a value in the text box.7.Click OK.

To remove an inspection dimension:
1.Choose Dimension > Inspect from the main menu. 2.In the Inspection Dimension dialog box, click Select Dimensions button. 3.Select dimensions to remove dimension inspection, and then press ENTER to finish selection and return to the dialog box. 4.Click Remove Inspection button.5.Click OK.
Adjust Dimension Space

Adjust Dimension Space
Once you have created multiple paralleled linear dimensions or angular dimensions, you can adjust the space among these paralleled lines with an equal value either default or specified. DIMSPACE command adjust the space among paralleled linear or angular dimensions or overlapped dimensions automatically in case that the original space is not equal values. If you set the space value to 0 when adjusting space among dimensions, you can align selected dimensions at the dimension line as well.
Add Geometric Tolerances

Add Geometric Tolerances
Geometric tolerances show acceptable deviations of form, profile, orientation, location, and runout of a feature. You add geometric tolerances in feature control frames. These frames contain all the tolerance information for a single dimension. Geometric tolerances can be created with or without leader lines, you can create them with TOLERANCE or LEADER command.
A feature control frame consists of two or more components. The first feature control frame contains a symbol that represents the geometric characteristic to which a tolerance is being applied, for example, location, profile, form, orientation, or runout. Form tolerances control straightness, flatness, circularity and cylindricity; profiles control line and surface. In the illustration, the characteristic is position.
Geometric Tolerance Dialog Box
Specifies the symbols and values for a feature control frame.
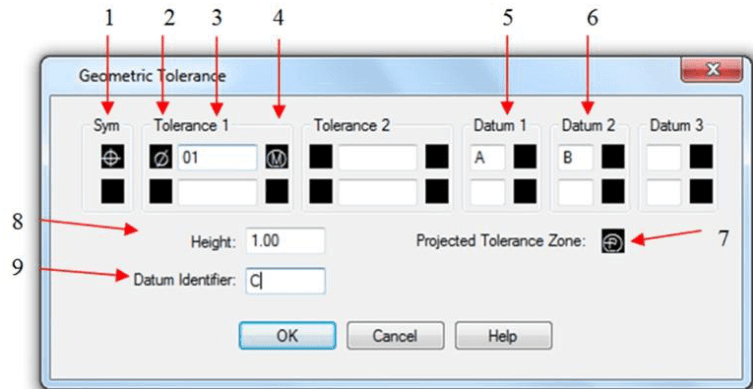
Geometric Characteristics symbol (menu)
-
Tolerance Zone form (toggle)
-
Tolerance zone value
-
Material condition symbol (menu)
-
Datum reference 1 of 3
-
Datum reference 2 of 3
-
Projected tolerance zone symbol (toggle)
-
Projected tolerance zone value
-
Datum identifier
Geometric Tolerance Symbols
The geometric tolerance symbols and their characteristics are shown in the following.
-
Position (Location)
-
Concentricity or Coaxiality (Location)
-
Symmetry (Location)
-
Parallelism (Orientation)
-
Perpendicularity (Orientation)
-
Angularity (Orientation)
-
Cylindricity (Orientation)
-
Flatness (Orientation)
-
Circularity or roundness (Form)
-
Straightness (Form)
-
Profile of a surface (Profile)
-
Profile of a line (Profile)
-
Circular runout (Runout)
-
Total runout (Runout)

Material Conditions
Depending on control type, you can add a diameter symbol prior to the tolerance value, and specify a material condition symbol behind this value. You can apply material conditions to features that can vary in size.
Datum Reference Frames
A datum reference consists of values and modifying symbols. A datum is a theoretically exact geometric reference that measures and verifies a theoretically exact point, axis, or plane. The system provides up to three datum reference letters and relative symbols followed by the tolerance value.
Projected Tolerance Zones
Projected tolerance zones control the height of the fixed perpendicular part of the extension area, and control tolerance accuracy by positional tolerances. Before you set the symbol to projected tolerance zones, you set a height value to specify the minimum projected tolerance zone.
Composite Tolerances
A composite tolerance consists of two tolerances that applied to the same geometric characteristic of a feature or for features that have different datum requirements. Before you create a dimension and add a composite tolerance for a drawing, you have to specify the first line of a feature control frame and then choose the same geometric characteristic symbol for the second line of the feature control frame. The specified geometric symbol compartment is extended over both lines. Then you can create a second line of tolerance symbols.
To add a geometric tolerance:
1.Choose Dimension > Tolerance from the main menu. 2.In the Geometric Tolerance dialog box, click the first square under Sym and select a symbol to insert. 3.Under Tolerance 1, click the first black box to insert a diameter symbol. 4.In the Text box, type the first tolerance value. 5.To add a material condition, click the second black box and click a symbol to insert it. 6.Under Tolerance 2, repeat steps 3 through 5 to add a second tolerance value. 7.Under Datum 1, Datum 2 and Datum 3, enter the datum reference letter. 8.Click the black box to insert a material condition symbol for each datum reference. 9.In the Height box, type a projected tolerance zone height value, if appropriate. 10.To insert a projected tolerance zone symbol, click the Projected Tolerance Zone box. 11.In the Datum Identifier box, add a datum value and then click OK. 12.In the drawing, specify the location of the feature frame.

Blocks, Attribute and reference

Blocks, Attribute and reference
Create and Insert Blocks
Usually, blocks are several objects combined into one that you can insert into a drawing and manipulate as a single object. Blocks can help you better organize your work, quickly create and revise drawings, and reduce drawing file size.
Create Blocks
Usually, blocks are several objects combined into one that you can insert into a drawing and manipulate as a single object. A block can consist of visible objects such as lines, arcs, and circles, as well as visible or invisible data called attributes. Blocks are stored as part of the drawing file. You can use several methods to create blocks:
-Combine objects to create a block definition in your current drawing. -Create a drawing file and later insert it as a block in other drawings.
To create a block for use within a current drawing:

1.Choose Draw>Block> Make from the main menu. 2.In the Block Definition dialog box, enter a block name in the Name box. 3.Click Pick point button to specify the insertion point for the block in the drawing area. 4.Click Select objects button to select the objects for the block, then press Enter after selection. Then click OK button.
Create Nested Blocks
You can define blocks and other blocks as nested blocks so as to simplify the organization of complicated blocks. With nested blocks, you can build a single block out of several components. But you should notice that blocks that reference themselves cannot be inserted.


Create Drawing Files for Use as Blocks

Create Drawing Files for Use as Blocks
You can create a block as a separate drawing file that you can insert into other drawings.
To save a block as a separate drawing file:
1.On the command line, type WBLOCK. 2. Under Source area, choose one of the following:
-Block: Saves existing block object to a separate drawing file. -Entire drawing: Saves the entire drawing to a separate drawing file. -Objects: Saves those objects you select to a separate drawing file.
- Under Destination area, type the name of the drawing file you want to create and choose the saved path, click OK to save.
Change the Base Point of Drawings to Be Used as Blocks
When inserting a drawing file into another drawing as a block, by default, system uses the origin (0,0,0) of WCS as the base insertion point. To specify different insertion point, you can use BASE command. Next time you insert the same block, system uses the new insertion point by default.
Update Changes in the Original Drawing
Once the drawing file has been inserted into another drawing as a block, the original drawing changes as well. But the block having been inserted will not change. If the block happens to change along with the original drawing, you should attach it as external reference but not as a block.
Use Paper Space Objects in Blocks
Objects created in paper space are not contained in the block when it is being inserted into the drawing. You can convert the objects in paper space as block or save as an individual drawing file before inserting into other drawings.
Insert Blocks

Insert Blocks
You can insert blocks and other drawings into the current drawing. When you insert a block, it is treated as a single object. When you insert a drawing, it is added to the current drawing as a block. You can then insert multiple instances of the block without reloading the original drawing file. If you change the original drawing file, those changes have no effect on the current drawing unless you redefine the block by reinserting the changed drawing.
To insert a block:
1.Choose Insert > Block from the main menu. 2.In the Insert Block dialog box, under Insert, click Block Name. 3.In the Name box, select the name of the block you want to insert. 4.If you want to use the pointing device to specify the insertion point, scale, and rotation, select Specify On-Screen. Otherwise, enter values in the Insertion Point, Scale, and Rotation boxes. 5. Click OK to insert.

To insert an entire drawing into the current drawing:
1.Choose Insert > Block from the main menu. 2.Click Browse to specify the file from the Insert Block dialog box. 3.You can use the default insertion point, scale, and rotation or select Specify On-Screen and enter values in the Insertion Point, Scale, and Rotation boxes. 4.If you want the objects in the block to be inserted as individual objects instead of as a single block, select Explode. Precondition is the block you created is allowed to explode. 5.Click OK to insert.
Modify a Block Definition
You can redefine all instances of a block within the current drawing. To redefine a block that was created in the current drawing, you create a new block using the same name. You can update all the blocks in the current drawing by redefining the block. If the block was inserted from a separate drawing file that was subsequently updated, reinsert that block to update all other instances in the current drawing.

To redefine a block in the current drawing:
1.Choose Draw > Block > Make from the main menu. 2.In the Block Definition dialog box, type the name of the block you want to redefine in the Name box. 3.Click Pick point button to specify a point as the insertion point for the block in the drawing area. 4.Click Select objects button to select the objects for the block, and then press Enter after selection. 5.Click OK. 6.Click Yes in the prompt box that displays to redefine the block in the current drawing.
Remove Block Definitions

Remove Block Definitions
Too many block definitions in a drawing file may affect the drawing size. To reduce the size of a drawing, you can remove unused block definitions. Erasing a block reference from a drawing may delete the block reference but retain the block definitions in the block definition table. Using PURGE command can help removing unused block references from your drawing in order to reduce the drawing size. You should erase all references from a block before you can purge the block definition.
Define and Use Block Attributes
An attribute is a particular object that you can save as part of a block definition. Attributes consist of text-based data. You can use attributes to track such things as part numbers and prices. Attribute values are either fixed or variable.

To define an attribute:
1.Choose Draw>Block> Define Attributes from the main menu. 2.Under the Attribute, type the tag, prompt, and default text. 3.Under Insertion Point, specify the location of the attribute, or click Specify on-screen to select a point in the drawing. 4.Under Mode, select the optional attribute modes. 5.Under Text Settings, specify the text characteristics. 6.To add the attribute to the drawing, do one of the following: -Click Define to add the attribute and keep the dialog box active so you can define another attribute. -Click Define and Exit to add the attribute and end the command.

To edit an attribute definition:
1.On the command line, type DDEDIT. 2.Select the attribute definition text to edit. 3.Modify the attribute tag, prompt and default in the Edit Attribute Definition that displays. 4.Click OK.
Modify Block Attributes

Modify Block Attributes
You can use the Block Attribute Manager to modify attributes in block definitions. For example, you can modify the following items:

-Attributes of blocks can be displayed after modification. -Text properties that define how attribute text is displayed in the drawing. -Properties that define the layer that the attribute is on and the attribute line's color, weight, and type
To edit an attribute attached to a block:
1.On the command line, type DDATTE. 2.Select the block to edit. The Edit Attributes dialog box displays all the attributes attached to the block you select. 3.Edit the attribute values as necessary. Then click OK.
Extract Block Attribute Data


Extract Block Attribute Data
Enter EATTEXT to start Attribute Extraction if the blocks in the drawing contain attributes. You can extract block information according to the wizard prompt and generate list so as to overview the attributes information of the blocks. You can get guide information from the wizard until you accomplish selecting drawings, blocks and block attributes.
With the extract block attribute data function, you can easily create list using drawing data through extracting attribute information and export to external files.
Synchronize Attributes
The ATTSYNC command applies attribute changes in block definitions to all block references of the same name. You can use this command to update instances of blocks containing attributes that were redefined using the BLOCK or BEDIT commands. ATTSYNC does not change any values assigned to attributes in existing blocks. ATTSYNC removes all changes of format or features that are made by ATTEDIT or EATTEDIT commands. And it also deletes all extended data associated with blocks and might affect dynamic blocks and blocks created by third-party applications.
Reference Other Drawing Files (Xrefs)
External references provide additional capabilities not available when you insert a drawing as a block. When you attach an external reference, however, any changes you make to the original drawing file are reflected in the drawings that reference it. External references are useful for assembling master drawings from component drawings. Use external references to coordinate your work with others in a group. External references help reduce the drawing file size and ensure that you are always working with the most recent version of a drawing.
Attach External References
When a drawing is attached to current drawing as external reference, it will be linked to the drawing, any changes to the referenced drawing may affect the external reference in current drawing. External references are inserted into the drawing as block definitions and used as single objects, but you should distinguish the external references and blocks.
To attach an external reference:

1.Choose Insert>External References from the main menu. 2.Clickthe DWG icon at the top left of the window. 3.In the Select Reference File dialog box, specify the drawing file to attach and then click Open. 4.In the External Reference dialog box, under Reference Type, choose how you want to insert the drawing: -Attachment: Inserts a copy of the drawing and includes any other drawings references. -Overlay: Lays a copy of a drawing over your original drawing 5.Make any additional selections and then click OK. 6.If you marked Specify On-screen for any items, follow the prompts to attach the external reference
Control the Properties of Referenced Layers

Control the Properties of Referenced Layers
You can control the visibility, color, linetype, and other properties of an xref's layers and make these changes temporary or permanent. If the VISRETAIN variable is set to 0, these changes apply only to the current drawing session. You can also control the fade display through XDWGFADECTL variable. In addition you can control Xref layer properties directly into the Layer Manager Properties dialog box.
Xref Clipping Boundaries

Xref Clipping Boundaries
You can control whether to display clipping boundary of xref through setting system variable XCLIPFRAME. Also you can Clip Xrefs by selecting the option on the menu bar: Modify>Clip>Xref
Nest and Overlay External References

Xrefs can be nested in another xref and attached to current drawing. In the process of attaching, you can select insertion position, scaling factor and rotation angle for xrefs.
Binding an Xref to a Drawing

To provide a copy of a drawing containing external references to someone else, you must also provide all the external reference files. Binding the external references makes them a permanent part of the drawing, which is similar to inserting a separate drawing as a block. You can bind external references by doing right click to the selected Xref file.
Refresh Xrefs
You can refresh the Xref by clicking the refresh button located at the top of the External Reference Dialog Box.

DGN Underlay
In GstarCAD 2025 version, the full DGN files are supported and related commands such as DGNIMPORT, DGNATTACH, DGNADJUST, DGNMAPING, etc are available. Now you can import and attach as underlay a Microstation native format.
DWF Underlay

DWF Underlay
GstarCAD supports DWF Underlay, you can insert a DWF file as Underlay.
PDF Underlay


If you receive project drawings in the form of a PDF file, you can reuse that PDF data in your own GstarCAD drawing files.

After inserting the PDF file as underlay, then you can start drawing or placing geometry at specific point of the underlay.

What’s more, you can adjust the underlay display like contrast, fade, monochrome, and colors for background through the properties palette.
About Clipping Underlays

The clipping boundary can be specified as a limited portion of the external reference graph, block reference, graphics, viewport, and underlay. You can clip external reference such as DGN、DWF、IMAGE、PDF and other underlay or block reference. You can use clipping boundary to determine the external reference or block reference section that you want to display, or to hide the redundant parts of the reference inside or outside the boundary by the following methods.
The boundary can be a polyline, a rectangle, or a polygon whose vertexes are limitedwithin the global scope of the underlay. You can modify the boundary of the graphics to be clipped. When you clip the graphics, you do not change the object in the external reference or block, but only change the way they are displayed.


Edit Reference Tab


With REFEDIT function allows you to edit blocks as reference. Users can access this function from toolbar in the classic interface and also there is an edit reference panel in ribbon interface. In edit reference panel, users can select the options like save changes, discard changes, add to working set and remove from the working set base on block modifications. Now you can edit an xref or a block definition directly within the current drawing.
The objects that you select from the selected xref or block are temporarily extracted and made available for editing in the current drawing. The set of extracted objects is called the working set, which can be modified and then saved back to update the xref or block definition.
Reference Edit Dialog Box

Identify Reference Tab: Provides visual aids for identifying what to edit and control how it is selected.
5Reference Name: Displays the reference selected for in-place editing and any references nested within the selected reference. If multiple references are displayed, choose a specific xref or block to modify. Only one can be edited in place at a time.
Preview: Displays a preview image of the currently selected reference as it was saved in the last drawing. The reference preview image is not updated when changes are saved.
Path: Displays the file location of the selected reference. If it is a block, no path is displayed.
Automatically Select All Nested Objects: Controls whether nested objects are included automatically in the reference editing session.
Prompt to Select Nested Objects: Controls whether nested objects must be selected individually in the reference editing session.

Settings Tab
Create Unique Layer, Style, and Block Names: Controls whether layers and other named objects extracted from the reference are uniquely altered. If selected, named objects in xrefs are altered (names are prefixed with #), similar to the way they are altered when you bind xrefs. If cleared, the names of layers and other named objects remain the same as in the reference drawing. Named objects that are not altered to make them unique assume the properties of those in the current host drawing that share the same name.
Display Attribute Definitions for Editing: Controls whether all variable attribute definitions in block references are extracted and displayed during reference editing. If Display Attribute Definitions for Editing is selected, the attributes (except constant attributes) are made invisible, and the attribute definitions are available for editing along with the selected reference geometry. When changes are saved back to the block reference, the attributes of the original reference remain unchanged. The new or altered attribute definitions affect only subsequent insertions of the block; the attributes in existing block instances are not affected. Xrefs and block references without definitions are not affected by this option.
Lock Objects Not in Working Set: Locks all objects not in the working set. This prevents you from accidentally selecting and editing objects in the host drawing while in a reference editing state. The behavior of locked objects is similar to objects on a locked layer. If you try to edit locked objects, they are filtered from the selection set.
PDF Import and Export

You are able to import TrueType text, the geometry, and raster images from a PDF file or underlay into a current drawing as GstarCAD objects.

GstarCAD 2025 also supports to export to PDF file format. You can access this feature from File button - Export - PDF or input EXPORTPDF from the command line.
Hatches and Raster Images

Hatches and Raster Images
Hatches
Define Hatch Boundary
To create a hatch, you should define hatch boundaries first by means of selecting objects to be hatched or picking a point inside the desired object. A hatch boundary can be any combination of objects, such as lines, arcs, circles, and polylines that forms an enclosed area.
Control the Hatching in Islands
You can specify methods of hatching objects in outermost boundary as normal, outer and ignore. Normal is the default hatch pattern. Besides, you can view hatching results of different types in the Islands area on Hatch tab of the Hatch and Gradient dialog box.
Normal: Hatch the pattern from the outer boundary to inside. Hatching process will be stopped when encounter inner crossing points, and continue hatching until second inner crossing point appears.
Outer: Hatch from the outer most layer of configuration, and keep the internal blank.
Ignore: Ignore internal objects, only hatches outer objects.
To select objects for hatching:
1.Choose Draw > Hatch from the main menu. 2.From the Hatch and Gradient dialog box, click the Island detection option, and then choose one of the following islands: Normal, Outer, Ignore:

3.To keep any new objects that are created for drawing the boundary hatch, select the Retain Boundaries check box under Other options. Existing objects are always retained. 4.In the Boundaries, click Select Objects button. 5.In the drawing, click the objects to be hatched individually, and then press Enter when done. 6.In the Hatch and Gradient dialog box, click OK.
Select an area for hatching:
1.Choose Draw > Hatch from the main menu. 2.From the Hatch and Gradient dialog box, click the Island detection option, and then choose one of the following islands: Normal, Outer or Ignore.

3.To keep any new objects that are created for drawing the boundary hatch, select the Retain Boundaries check box under Other options. Existing objects are always retained. 4.In the Boundaries, click Pick Points button. 5.In the drawing, click inside the closed perimeter of a boundary. If desired, continue clicking inside additional closed perimeters. 6.To complete the selection, press Enter. Then click OK button.

Choose and Define Hatch Patterns
Hatch pattern consists of a repeating pattern of lines, dashes, and dots. You can select a hatch pattern from a set of predefined patterns, or you can define a pattern of your own. The hatch pattern you used most recently is the default pattern the next time you add hatching. The program supplies predefined standard hatch patterns, which are stored in the ICAD.pat and ICADISO.pat hatch pattern library files.
To specify a predefined hatch pattern:

1.Choose Draw > Hatch from the main menu. 2.In the Hatch and Gradient dialog box, click the Hatch tab. 3.Beside Type, click Predefined to apply a scale factor to make the pattern larger or smaller than the default size. 4.Enter the scale factor as a percentage of the default. 5.Enter the angle in degrees (1-360). The default angle is clockwise, you can change the angle of any hatch pattern by entering a numerical value. 6.Enter the ISO pen width. This option is only available if you select existing ISO hatch pattern in the Pattern option. 7.To copy the pattern properties from an existing hatch, choose Inherit Properties. 8.To associate the hatch pattern to its boundary objects, under Other options, select the Associative check box. An associative hatch updates automatically if you move any of its boundaries. 9.To continue, add a hatch by selecting objects or picking points to selected area or boundary you want to hatch.
To specify a user-defined hatch pattern:
1.Choose Draw > Hatch from the main menu. 2.From the Hatch and Gradient dialog box, click the Hatch tab. 3.Beside Type, in the Type list, click User Defined. 4.For Spacing, enter the line spacing for the pattern. 5.To copy the pattern properties from an existing hatch, choose Inherit Properties, and select a hatch pattern from a hatched object in the drawing. 6.To associate the hatch pattern to its boundary objects, under Other options, select the Associative check box. An associative hatch updates automatically if you move any of its boundaries. 7. To continue, add a hatch by selecting objects or picking points to selected area or boundary you want to hatch.


To use a predefined library pattern:
1.Choose Draw > Hatch from the main menu. 2.Click the Hatch tab. 3.Select a Predefined type. 4.To select a predefined pattern, do one of the following: -In the Pattern list, click the pattern name. -Click the graphical representation of the hatch pattern. 5. To continue, add a hatch by selecting objects or picking points to selected area or boundary you want to hatch.

Options in Gradient tab:
Draw Order: Assigns a draw order to a hatch or fill. You can place a hatch or fill behind all other objects, in front of all other objects, behind the hatch boundary, or in front of the hatch boundary.
Layer: Assigns new hatch objects to the specified layer, overriding the current layer. Select Use Current to use the current layer.
Transparency: Sets the transparency level for new hatch or fills, overriding the current object transparency. Select Use Current to use the current object transparency setting.
Hatch to Back
In order to avoid a filling pattern blocks any text, label or other graphics on the current drawing, you can set the display order of all the fill patterns to back position from all other objects with HATCHTOBACK command.
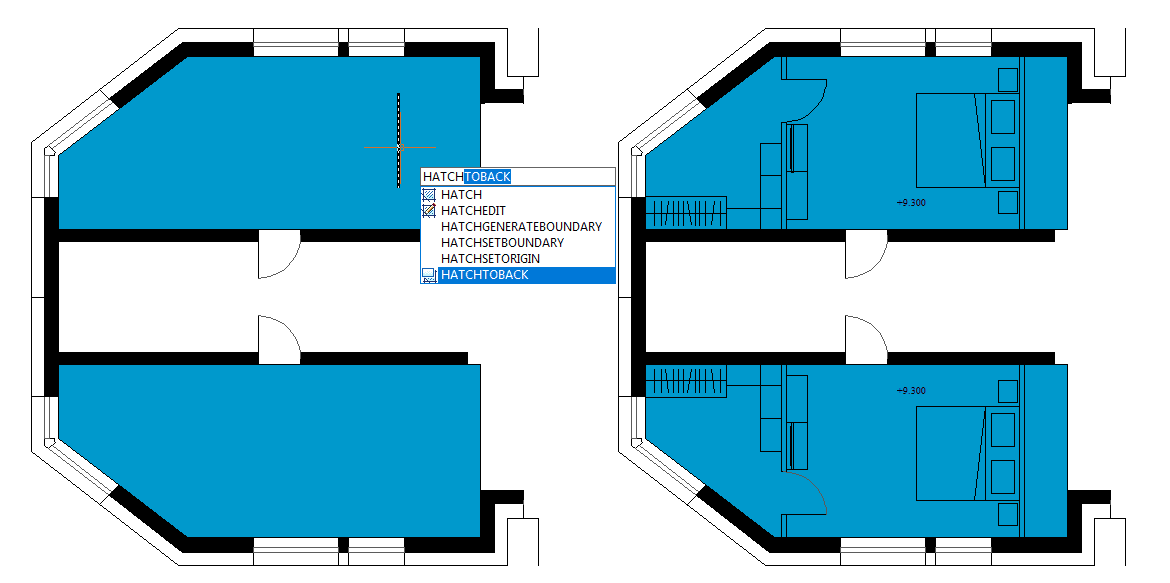
Work with Raster Images
You can view and manipulate raster images and associated file paths in your drawings.
Attach, Scale, and Detach Raster Images
Raster images consist of a rectangular grid of small squares or dots known as pixels. Raster images can be copied, moved, or clipped as well as a normal object in the drawing. You can also adjust the contrast, transparency, image quality and image frame visibility. Additionally, when inserting raster images, the file format depends on the content of the file rather than the extension name. The following table display all the image file formats supported:
| Type: | Description and versions: | Extension: |
|---|---|---|
| BMP | Windows and OS/2 bitmap format | .bmp |
| ECW | Enhanced Compression Wavelet | .ecw |
| JFIF or JPEG | Joint Photographics Expert Group | .jpg or .jpeg |
| PCX | Picture PC Paintbrush Picture | .pcx |
| PNG | Portable Network Graphic | .png |
| TGA | True Vision Raster-Based Data Format | .tga |
| TIFF | Tagged Image File Format | .tif or .tiff |
Attach Raster Images

Attach Raster Images

Use IMAGEATTACH command to select and attach raster images, or bitonal, 8-bit gray, 8-bit color, or 24-bit color image files to a drawing. The image file can be inserted as blocks as many times as you like once attached to the current drawing, you can clip the attached raster image and setup its lightness, contrast, fading and transparency.

To attach a raster image:
1.Choose Insert > Raster Image reference from the main menu. 2.Specify a file to attach, and then click Open. 3.In the Image dialog box, in the Insertion point and Scale, click Specify on-screen. Specify an angle value in Rotation, and then click OK. 4.Specify a insertion point. 5.Specify a scale.
Scale Raster Images
You can specify scale factor in the Image dialog box, otherwise to attach it by its original size. The raster image will be scaled by the specified factor, the scale factor is used without unit by default.
Detach Raster Images
Raster images can be detached if it no longer needs to use in the drawing, a specified image detached from the drawing together with its multiple copies, links and definitions, but the original image file will not be influenced.
Modify and Manage Raster Images
Controls the properties such as displaying and clipping boundary of raster images. You can view and manipulate attached raster image and change its saving path in Image Manager. Users can turn on/off image boundary in current view using IMAGEFRAME command and setting up the values 0 (off) 1(on).
To turn image frames on or off for all images:

1.Choose Modify>Object> Image> Frame 2.Do one of the following to toggle frames off and on: -Type value 1 to display and print frames for all images in a drawing. -Type value 0 to hide all frames on the screen and during printing.


To clip an image in the shape of a rectangle and polygon:


1.Choose Modify>Clip> Image 2.Select the edge of the image you want to clip. 3.Type N (New boundary) to create a new clipping boundary. 4.If you choose Rectangular: -Define the first corner of the clipping rectangle. -Define the second corner of the clipping rectangle. The selected image is clipped so that only the interior of the rectangle is visible. 5.If you choose Polygon: -Select the points for the polygon, and then press Enter when the polygon is complete. The selected image is clipped so only the interior of the polygon is visible.
Change Raster Image Brightness, Contrast, and Fade
Use IMAGEADJUST to adjust displaying result and lightness, contrast and fade that are related to the display and plot effect when plotting drawings. IMAGEADJUST does not affect the original raster image as well as other instances of the image.

Improve the Display Speed of Raster Images
You can adjust the display speed by setting the raster image quality. The image quality is sorted into high and draft levels, If the quality is set to draft, the image will be displayed with some granular materials, however with faster display speed.
Layout, Plot and Publish Drawings

Layout, Plot and Publish Drawings
Create Multiple-View Drawing Layouts
Overview of Layout

A layout represents a plotted page on which one or more model views are displayed. GstarCAD provides two collateral working environments as Model and Layout tab. You can create thematic models on Model tab. Multiple slides of the model can be set in Layout tab. Use these general steps to prepare your drawing for printing multiple layouts:
- On the Model tab, create your drawing. 2. Create a new layout. You can use an existing Layout1 or Layout2 tab, or you can create a new Layout tab. 3. Create at least one layout viewport on the Layout tab. Use each viewport to help control which portion of the drawing prints and at what scale. 4. Specify additional settings for the layout, such as the scale of the drawing, print area, print style tables, and more. 5. Print or plot your drawing.
You can right click on Layout tab and select "New layout" to create a new layout, and also import layout from template. Options on Shortcut menu are listed:
Work with Model Space and Paper Space

Work with Model Space and Paper Space
Model space is generally used for creating and editing drawings. Preparations for plotting are usually working on paper space for the drawings on layouts are close to the plotting effects.

Model space is an area in which you create two dimensional and three dimensional objects based on either the World Coordinate System (WCS) or a user coordinate system (UCS). The contents of paper space represent the paper layout of your drawing. In this work area, you can create and arrange different views of your model similar to the way you arrange detail drawings or orthogonal views of a model on a sheet of paper.
Layout tab is enabled to make relevant plot settings. Paper space is provided in each layout option, and you are allowed to create viewports and specify page setup such as paper size, orientation and location that can be saved together with the layout.
You can save and name the page setup and apply it to other layouts when setting pages. You can also create new layouts using existing layout template file (DWT or DWG). Click on the Model tab, you can view and edit objects in model space.
Specify Layout Settings
Once created a drawing in Model tab, you can toggle to Layout tab and setup the layout for plotting, such as paper size, drawing orientation and so on. You can right click on the Layout tab to create new layouts or import from template files, and then click Modify button on the Page Setup Manager dialog box to set the page.
Select a Paper Size for a Layout
The paper size here refers to the size of the drawing. When you start Plot dialog box in Layout tab, you can assign the paper type from pull down list of the Paper Size text box. The Paper size is directly previewed from the sketch with its size and units. The available paper types provided in the pull down list are decided by the current configuration. If you want to configure plotters to export raster images, you must specify output size by pixels. The paper size can be customized in the Plotter Configuration Editor.
Determine the Drawing Orientation of a Layout

Determine the Drawing Orientation of a Layout
The drawing orientation is sorted into Landscape and Portrait, which decide the plotting orientation of the drawing to be seen on a paper. Once specified the drawing orientation, you can control whether to plot the top or the bottom of the drawing by selecting Plot Upsize-down option. The changes setup in Page Setup dialog box are still saved in layouts. Certain page settings can be replaced by customized plot settings, but the settings will not be saved in the layout unless you click Apply to Layout option.
Adjust the Plot Offset of a Layout

You can offset the geometry on the paper by entering a positive or negative value in the X and Y Offset boxes. Changing the plotting origin may change the position of drawing on papers. The plot origin locates at the left lower corner of plotting area with offset value of 0 relative to X and Y direction. Select Center on Paper if the specified plot area is part of the drawing rather than the whole layout, which changes the position of plot origin.

Plot with origin (10,10)Plot with origin (0,0)
Set the Plot Area of a Layout

You can set the area to be plotted in Plot dialog box. When creating new layouts, the default plot option is drawing limits which means plotting all the objects within the drawing paper. The plot origin is (0,0), located at the left lower corner of the page. Do the following methods to select a plot area:
-Layout: Plots all the objects within the drawing paper. -Window: Set the Plot Scale for a Layout, Plots any portion of the drawing you specify within the rectangle window. Click the Window button to use a pointing device to specify opposite corners of the area to be plotted, and then return to the Plot dialog box. -Extents: Plots the portion of the current space of the drawing that contains objects. -Display: Plots the contents displayed in current view.
Set the Plot and Lineweight Scale for a Layout
When you specify a scale to output your drawing, you can choose Fit to Paper to scale the drawing to fit onto the selected paper size. Usually, the objects in model space are displayed at the scale set in layout viewports. To plot the objects in model space with the scale specified in layouts, you assign the scale to 1:1.Even if plot scale of layouts is assigned, it's enabled to scale the lineweight at a certain scale. Scaling the lineweight is nothing to do with the plot scale when plotting drawings, which is mainly used for the lines included in the objects to be plotted.
Move and Copy Layouts


Move and Copy Layouts
You can right click on the Layout tab to select Move or Copy option, on the Move or Copy dialog box. You can select a layout which you want to place after the current layout. To Create a Copy of current layout, you can select a layout and check Create a Copy, the copied layout will place before the layout you selected. You should notice that Model tab can't be moved or copied.
Create Layout from Template


Create Layout from Template
Right click on the Layout tab to select from template option to import DWG or DWT file directly, using information of existing template to create new layouts. System provides template file with extension name as .dwt. Layout templates from any drawing templates can be imported into the current drawing.
To create a new layout from an existing file:
- Choose Insert>Layout>Layout from Template 2. In the dialog box, select the desired template file, and then click Open. In the Insert Layout(s) dialog box, select the layout(s) you want to insert, and then click OK. You can choose multiple layouts by holding down Ctrl while selecting layout names.
Create and Modify Layout Viewports
On a Layout tab, you must create at least one layout viewport to see your model. Each layout viewport is created as a separate entity that you can move, copy, or delete. Any changes you make in one layout viewport are immediately visible in the other viewports (if the other layout viewports are displaying that portion of the drawing). Zooming or panning in the current viewport affects only that viewport.

Create layout viewports:

- On the command line, type MVIEW. 2. Type F (Fit), or create 2, 3 or 4 viewports by entering 2, 3 or 4 separately, or specify two opposing corners to create a custom viewport. 3. Choose the viewport arrangement, typing H (Horizontal) or V (Vertical). 4. Do one of the following: -To arrange the viewports to fill the current graphic area, type F (Fit)。-To fit the viewports within a bounding rectangle, specify the corners of a rectangle.
You can create a single layout viewport, or you can divide the graphic area into many viewports arranged [Horizontal/Vertical/Above/Below/Left/Right].

To modify layout viewport properties:
-
Click the border of the layout viewport whose properties you want to modify.
-
Open the Properties palette through the menu option "Tools >Palettes>Properties" or "Modify > Properties".
-
In the Properties palette, select Standard Scale, and then select a new scale from the list. The scale you choose is applied to the viewport.

Turn Layout Viewports On or Off:
1.Click the desired Layout tab.
-
Type MVIEW and then press Enter.
-
Type ON or OFF.
-
Select the edge of the layout viewport to turn on or off, then press Enter.

Create Non-rectangular layout viewports:
Use Object and Polygonal options of MVIEW to create irregular viewports,
Select Object option to convert objects created in paper space to viewports. While selecting Polygonal option to draw irregular polylines including arcs and lines which are enabled to either intersect or three vertexes at least, the polyline will be closed automatically.
Plot Drawings
When a drawing is completed, you can output it using several methods. You can plot the drawing on paper or create a file for use with another application.
Plot Settings

Plot Settings
When you create a drawing, you do most of your work on the Model tab. At any time you can print your drawing to see how it looks on paper. It's easy to startup printing, and then later create layouts and custom print settings to enhance your printed output.
To start printing:
-
Choose File > Plot from the main menu.
-
Set the printer and relevant parameters, and then click OK.
Set Paper Size


Set Paper Size
You can assign the paper type from pull down list of the Paper Size text box. If you want to setup paper size, you should configure plotters first, all the available plotters are both system plotters of Windows configured and non-system driven.
To select a printer or plotter:
-
Choose File > Plot from the main menu.
-
From the Name list in Printer/Plotter area, select a printer or plotter you want to use, and then click OK.
Position the Drawing on the Paper
You can adjust the position of the drawing to be plotted on a paper before plotting.
To specify the print area origin:

- If necessary, click the desired Layout tab or the Model tab. 2. Choose File > Plot from the main menu. 3. Do one of the following in the Plot Offset area: -To center the specified print area on the printed page, select Center the Plot check box. -To specify an origin for the print area, type the X and Y coordinates. 4. Select OK, and then click Apply to Layout.
Set Drawing Orientation

Set Drawing Orientation
The drawing orientation determines whether to plot a drawing portrait or landscape. If you select Landscape, plots the drawing using the length edge as horizontal. While selecting Portrait to plot the drawing using its minor edge as horizontal Changing, the drawing orientations just like rotating the paper under the drawing. Meanwhile, selecting Plot upsize-down to control whether to locate the drawing upsize-down on paper.
Set Plot Scale

Plot scale of the drawing can be specified directly from the Scale pull-down list in Plot Scale area of Plot dialog box. You can also choose User define to set desired plot scale, or choose Fit to Paper to scale the drawing to fit onto the selected paper size. The plot scale together with plot unit and drawing unit must be specified before plotting. For example, if you select the paper size to mm, entering 1 under mm and 10 under Units blank produces a plotted drawing with each plotted unit represents 10 actual millimeters.

To automatically scale the drawing for printing:
- If necessary, click the desired Layout tab or the Model tab. 2. Choose File > Plot from the main menu. 3. To scale the drawing to fit on one printed page, in Plot Scale, click Fit to Paper. 4. Select Apply to Layout and click OK.
Set Plot Options
The following options show plot patterns with instructions on how to plot objects.

-Plot in Background. Specifies the plot is processed in background. -Plot Object Lineweights. Specifies that lineweights assigned to objects and layers are plotted. -Plot with Plot Styles. Plots a drawing with specified plot styles. Plots lineweights automatically once by selecting this option automatically. If you do not select this option, objects are plotted with their assigned properties and not with the plot style overrides. -Plot Paperspace Last. Plots model space geometry first. Paper space geometry is usually plotted before model space geometry. -Hide Paperspace Objects. Suppresses the plotting of objects that are located behind other objects regardless of how it's displayed on screen. This option is only available in the Layout tabs. -Plot Stamp on. Horizontally or vertically places the plot stamp information on a specified corner of a drawing. The plot stamp settings can be saved to log file, also cannot be saved. -Save Changes to Layout. All the changes you make in the Plot dialog box will be saved to the layout if you click OK.
Specify the Area to Plot
To specify a portion of the drawing to print, if necessary, click the desired Layout tab or the Model tab.

- Choose File > Plot from the main menu. 2. Under Print Area, click one of the following: -Display – Plots the current view on the screen. -Extents – Plots the contents within the specified drawing extents. -Limits/Layout – Plots the contents within the specified drawing limits or entities in the printable area. -Window – Plots the portion of the drawing contained in the specified window. Click the Window button to use a pointing device to specify opposite corners of the area to be plotted, and then return to the Plot dialog box. 3. Select Apply to Layout and click OK.
Preview a Plot
Viewing a drawing before printing gives you a preview of what your drawing will look like when it is printed.
To preview a drawing before printing:
- If necessary, click the desired Layout tab or the Model tab. 2. Choose File > Plot Preview from the main menu. 3. Do one of the following: -To print the drawing, click preview and click Plot on the top left corner of print preview. -To return to the drawing, click the off button or press Esc.
Use Plot Styles

Use Plot Styles
Plot styles help you control what your drawing looks like when it is printed. Because plot styles are saved in plot style tables, which are files located on your computer, you can reuse them to help eliminate the need to reconfigure your print settings each time you print a drawing. A drawing can use one type of plot style table at a time. There are two types of plot style tables: -Color-dependent plot style tables (CTB) contain a collection of plot styles based on each of the 255 index colors available in a drawing.-Named plot style tables (STB) contain a collection of plot styles that you define. They can vary regardless of color.

To assign plot style tables:1. If necessary, click the desired Layout tab, or click the Model tab. 2. Choose File > Plot from the main menu. 3. Under Plot Style Table (pen assignments), select a plot style table in the one of the following: -None: Applies no plot style table. Objects plot according to their own properties. -Monochrome: Plots all colors as black. -New: Creates a new plot style table. 4. Select Save Changes to Layout, and then click Apply to Layout.
To Modify plot style tables:
- Choose File > Plot from the main menu. 2. Under Plot Style Table (pen assignments), click the plot style table you want to modify, and then click the button to display “Plot Style Table Editor”. 3. Click the General tab on Plot Style Table Editor, and then do any of the following: -Enter a new plot style description. -Select Apply global scale factor to non-ISO linetypes to apply the scale factor -Enter a scale factor to apply to non-ISO linetypes used for any plot style in the current plot style table.

-
Click the Form View tab, and then do any of the following: -Make changes to a color-dependent plot style by selecting it in the Plot list, and then make color, linetype, or lineweight changes for the plot style in Properties area. Your changes are saved automatically for the selected plot style. -Make changes to a named plot style by selecting it in the Plot list, and then make color, linetype, or lineweight changes for the plot style in Properties area. Your changes are saved automatically for the selected plot style. -Add a new plot style by clicking Add Style. Enter a new name, and then click OK. Select the options for the plot style. (Available for named plot styles only.) -Delete a plot style by selecting it in the Plot list, and then click Delete Style. (Available for named plot styles only.)
-
Click OK.
Plot Files to Other Formats
Plot files have various formats. You can output drawings in any image formats with unique plotter driver.

Publish Drawings
Specifies drawing sheets that you can assemble, reorder, rename, copy, and save for publishing as a multi-sheet drawing set. You can publish the drawing set to a DWF, DWFx, or PDF file or send it to the plotter named in the page setup for hardcopy output or as a plot file. The following options are displayed in the Publish Dialog Box:

-
Load Sheet List Button: Displays the Load Sheet List dialog box, in which you can select a DSD file or a BP3 (Batch Plot) file to load. 2. Save Sheet List Button: Displays the Save List As dialog box, in which you cansave the current list of drawings as a DSD file. 3. Sheet List: Displays the current drawing set (DSD) or batch plot (BP3) file.
-
Publish to: Defines how to publish the list of sheets. You can publish to either a multi-sheet DWF, DWFx, or PDF file.
-
Automatically load all open drawings: When selected, the contents of all open documents are automatically loaded in the publish list. 6. Add Sheets Button: Displays the Select Drawings dialog box, in which you can select drawings to add to the list of drawing sheets. 7. Remove Sheets Button: Deletes the selected drawing sheets from the list of sheets. 8. Move Sheet Up Button: Moves the selected drawing sheets up one position in the list. 9. Move Sheet Down Button: Moves the selected drawing sheets down one position in the list. 10. Preview Button: Displays the drawing as it will appear when plotted on paper by executing the PREVIEW command. 11. Sheet Name: Combines the drawing name and the layout name with a dash (-).
-
Page Setup/3D DWF:Displays the named page setup for the sheet. You can change the page setup by clicking the page setup name and selecting another page setup from the list 13. Status: Displays the status of the sheet when it is loaded to the list of sheets.
14/15.Show and select sheet details: Displays and hides the Selected Sheet Information and Selected Page Setup Information areas. 16. Publish Options: Opens the Publish Options dialog box, in which you can specify options for publishing. 17. Number of Copies: Specifies the number of copies to publish. 18. Precision: Optimizes the dpi of DWF, DWFx, and PDF files for your field: manufacturing, architecture or civil engineering. 19. Include Plot Stamp: Places a plot stamp on a specified corner of each drawing and logs it to a file. 20. Plot Stamp Settings: Displays the Plot Stamp Dialog BoxPlot Stamp Settings Dialog Box, in which you can specify the information, such as drawing name and plot scale that you want applied to the plot stamp. 21. Publish in Background:Toggles background publishing for the selected sheets. 22. Send the Sheets to the Plotter in Reverse Order: When selected, sends sheets to the plotter in reverse of default order. This option is available only if the Plotter Named in Page Setup option is selected. 23. Open in Viewer when Done: When publishing completes, the DWF, DWFx or PDF file will open in a viewer application.
Create and Edit Dynamic Blocks
Dynamic block references contain grips or custom properties that change the way the reference is displayed in the drawing after it is inserted. Dynamic blocks allow you to insert one block that can change shape, size, or configuration, instead of inserting one of many static block definitions.
Some dynamic blocks are defined so that geometry within the block can only be edited to certain sizes specified in the block definition. When you use a grip to edit the block reference, tick marks are displayed at the locations of valid values for the block reference. If you change a block property value to a value other than one specified in the definition, the parameter will adjust to the closest valid value.
Dynamic Block Editor
You can access the Block Editor by typing the edit command or by double-clicking the block without attribute. The Block Editor ribbon interface will show as below, the black arrows mark the stand for parameters, while the yellow lighting is the symbol for action. It will pop-up toolbars in a classic interface.

Dynamic Block Editor Tool Panels
Using the tools in this Tool Panel to define, edit and modify dynamic blocks definitions , makes it very convenient and fast.
Manage Save or Save as the default block; Create or edit another block.

Tool Define, edit or update the block attribute.

Parameter You can add parameters for Dynamic Blocks on this panel.

Action You can add actions for Dynamic Blocks on this panel.

Parameter Sets You can add the parameter set on this panel.

Visibility This panel is specially used for Visibility editing.

Close It is used to exit the Block Editor. Before exiting, some commands like save or open etc. might not work.

Parameters
Define custom properties for the dynamic block by specifying positions, distances, and angles for geometry in the block. You add parameters to a dynamic block definition in the Block Editor. In the Block Editor, parameters have an appearance similar to dimensions. Parameters define custom properties for the block. Parameters also specify positions, distances, and angles for geometry in the block reference. When you add a parameter to a dynamic block definition, the parameter defines one or more custom properties for the block.
A dynamic block definition must contain at least one parameter. When a parameter is added to a dynamic block definition, grips associated with key points of the parameter are automatically added. You must then add an action to the block definition and associate the action with a parameter.
Parameters also define and constrain values that affect the dynamic block reference's behavior in a drawing. Some parameters can have a fixed set of values, minimum and maximum values, or increment values. For example, a linear parameter used in a window block may have the following fixed set of values: 10, 20, 30, and 40. When the block reference is inserted in a drawing, you can only change the window to one of these values. Adding a value set to a parameter allows you to limit how the block reference is manipulated in a drawing.
Point Parameter Icon:

Command: BParameter→O Defines an X and Y location in the drawing. A point parameter can be associated with a move or stretch action.
Linear Parameter Icon:

Command: BParameter→L Shows the distance between two anchor points. Constrains grip movement along a preset angle. A linear parameter can be associated with a move, stretch, scale or array action.
Polar Parameter Icon:

Command: BParameter→P Shows the distance between two anchor points and displays an angle value. You can use both grips and the Properties palette to change both the distance value and the angle. A polar parameter can be associated with a move, scale, stretch, polar stretch, or array action.
XY Parameter Icon:

Command: BParameter→X Shows the X and Y distances from the base point of the parameter. It can be associated with a move, scale, stretch, or array action.
Rotation Parameter Icon:

Command: BParameter→R Defines an angle. The rotation angle can be in any value, or be defined in a range or a specified value.
Alignment Parameter Icon:

Command: BParameter→A Defines an X and Y location and an angle. An alignment parameter always applies to the entire block and needs no action associated with it. An alignment parameter allows the block reference to automatically rotate around a point to align with another object in the drawing. An alignment parameter affects the rotation property of the block.
Flip Parameter Icon:

Command: BParameter→F A flip parameter flips objects. You can associate a flip parameter with a flip action.
Visibility Parameter Icon:

Command: BParameter→V Controls the visibility of objects in the block. A visibility parameter always applies to the entire block and needs no action associated with it. In a drawing, you click the grip to display a list of visibility states available for the block reference.
Lookup Parameter Icon:

Command: BParameter→K Defines a custom property that you can specify or set to evaluate a value from a list or table you define. It can be associated with a single lookup grip. In the block reference, you click the grip to display a list of available values. You can associate a lookup parameter with a lookup action.
Base Point Parameter Icon:

Command: BParameter→B Defines a base point for the dynamic block reference relative to the geometry in the block. Cannot be associated with any actions, but can belong to an action's selection set.
Actions
Actions define how the geometry of a dynamic block reference will move or change when the custom properties of the block reference are manipulated in a drawing.

Move ICommand:BActionTool→M A move action causes objects to move a specified distance and angle such as a point, a linear, a polar, an XY parameter, etc, moves all objects in a selection set in a/any direction.


Scale Command:BActionTool→S A scale action such as a linear, a polar, an XY parameter, and so on, scales the selected objects in the direction of the parameter. Users can manipulate the grips in different way by changing the properties and values in the Properties palette.

Stretch Command:BActionTool→TA stretch action causes objects to move and stretch a specified distance in a specified location. A stretch action associated with a point, a linear, a polar, an XY parameter, etc.
Polar Stretch Command:BParameter→PIn A polar stretch action rotates, moves, and stretches objects a specified angle and distance when the key point on the associated polar parameter is changed through a grip or the Properties palette.A polar stretch action can only be applied to a polar parameter.

Rotate Command:BActionTool→P A rotate action is always associated with a rotate parameter. Selected objects can be rotated freely, or the way the grips are manipulated is different in the Properties palette.

Flip Command:BActionTool→F A flip action is always associated with a flip parameter.

Array Command:BActionTool→A An array action is associated with a linear, a polar, an XY parameter, etc, copies and arrays selected objects in different way.
Lookup Command:BActionTool→L A lookup action can only be associated with a lookup parameter.
The General Steps of Creating a Dynamic Block Definition
In order to get a Dynamic Block Definition, improve block editing efficiency and avoid repeating modifications, we can create Dynamic Block by the following steps.
Step1: Planning Before creating Dynamic Block, it is essential to plan Dynamic Block, plan the functions, appearance, the method of drawing and required Parameter(s) and Action(s) which are needed to achieve prospective functions.
Step2: Draw geometric figure The included basic pixel during Dynamic drawing, of course, you can draw these pixel in Block Editor.
Step3: Add Parameter and Action This is the most pivotal step when creating Dynamic Block. When editing the Parameter and Action, you not only consider the achievement of Parameter and Action, but also consider the readability of Dynamic Block and the convenience of Modification, let the action point of the Parameter attach on the corresponding pixel as far as possible, and put the Action near to its relevant parameter, if there are more Parameters and Actions, they still need to be renamed for understanding, editing and Modification.
Step4: Test Dynamic Block Save and Exit Block Editor, start the Dynamic Block test to check if it reaches to the prospective effect.
Dynamic Blocks Creation Samples
See what you are able to do within the Dynamic Block Editor, and get the most out of your design. See the follow samples:
Base Point Parameter

Base Point Parameter
Although the majority of parameters only taken into effect when operations are matched with actions, there are exceptions, base point parameter is one of them.
-
Define blocks: Define block and draw a circle in the block editor, as shown.
-
Add base point: Click "base point" parameter on the parameter panel, put the parameter on the center of the circle according to system prompt, as shown in the below illustration.


- Insert block: Save and exit block editor, insert the block in the model. You can realize, base point becomes the insert point of the block after adding the base point parameter. Please note, if you set an insert point via the block define dialog box, and add a base point parameter as well, the base point is the default insert point.
Visibility
Using the Visibility Parameter function, you can control the display and hide a certain view in Dynamic Block.
- Prepare view: Prepare a three cars view and define as block.


-
Add Parameter of Visibility: Enter into Block Editor by Double-clicking the Block or right- click the menu, click the button Visibility of Parameter in the Parameter panel, appoint the position of the Parameter according to the system prompt, as shown below.
-
Edit the states of Visibility: Double click the button Visibility, the Visibility States dialog box will be displayed. In the dialog box, you can rename, new and remove the Visibility States. In order to control the visibility of the three cars view in this example, we click on new for the three Visibility States as shown in the following picture.

Click the following button as shown in the picture and choose roadster in the pull down menu.


Click the “Invisibility” button in the Visibility tool panel, select truck and car, make them invisible in the “roadster” state, as shown in the following picture, after selecting, press enter to confirm. For the state of “Car” and “Truck”, set them in the same way.
- Move and Adjust: After finishing the editing of the Visibility States, move the three cars view to make them overlap as shown in the picture bellow.

- Test Dynamic Block: Insert the edited Dynamic Block into a drawing, select Dynamic Block and click the grip of Visibility Parameter, choose one item in the pop-up pull-down list, Dynamic Block will change the display state automatically, as shown in the following picture.

Alignment

Alignment
Alignment Parameter can give dynamic blocks the function of alignment automatically, which can save the step of rotating the blocks.
- Add an alignment parameter for a roughness symbol: Draw a roughness symbol in the Block Editor. Select the icon of the alignment parameter. Specify the location and the aligned orientation of the parameter following what the computer asked as shown in the picture, the dotted line is the align orientation.

- Test the dynamic block: Insert the roughness dynamic blocks, move the align grips, the symbol will align with the interface of the dimensions, as shown pin the picture below.
Flip: When you use the "roughness symbol block" to label the spare parts, the symbol is sometimes already in the right position, however, the characters' direction is not right. We need to add the "character flip" function to receive the correct label.

-
Add flip parameter: Click the "flip" parameter button, add the flip parameter according to prompt, as shown in the picture.
-
Add flip action: Click the flip action button on the action panel, match parameter and object for the action. Herein, we choose "roughness" as the object, and position the action button, as shown in below picture.


Use the same method to add a pair of flip parameter and action of the vertical direction, as shown:
Point Movement

Point Movement
- Draw a drawing: Draw a drawing and define it as a block.

-
Add point parameter: Click point parameter on the tool bar, define the parameter position according to prompt, as shown in the picture.
-
Add move action: Click move action button on action panel, match parameter and object for the action, and define the position. The position of action label does not affect the effect of the dynamic block, however, for the sake of beauty& convenience, try to put the label near the related parameter.


- Test dynamic block:Insert the dynamic block, drag the blue grip, then move the keyway to the right accordingly, as shown in below picture. Obviously, the dynamic block can achieve the expected results. Please pay attention, if it is not run with ortho constraint, the keyway can move towards every direction because the direction of the point parameter is random, the characteristic of the parameter decides the characteristic of action.
Linear Movement
Actually, limited to the demand of the material mechanics characteristics, keyway is only allowed to be placed on the central line. So, a horizontal movement is enough for keyway and the movement to other direction is not meaningful. Next we will take advantage of the linear parameter to define the keyway’s movement direction on the central line of

the step shaft.
- Draw: Draw the follow drawing and define it as a block.

- Add linear parameter: The way of adding a linear parameter is similar to dimension, both try to put the absorption point of the parameter on the central line of the step shaft.

- Add Move Action: Different from the point move, after specifying the parameter, the system will prompt: Specify parameter that is related to movement. Select right grip of parameter as “Related parameter point”, as shown in the following picture.

The parameter point we mentioned corresponds to the operate point of Move. After exiting Block Editor you can drag this point to make dynamic block change correspondingly. After selecting the related parameter point you can specify the move objects for action, as shown in the following picture. Place action label, save and exit dynamic block.

4 .Test Dynamic Block: Select dynamic block and drag the right grip of the parameter. Meanwhile, no matter how the cursor moves, the keyway is limited to the central line of the step shaft. That is to say with the limitation of the linear parameter, the dynamic block can only move along the direction specified by the linear parameter.

Number of Grips
In the Block Editor, select the linear parameters, change the number of grips to “1” in the properties panel.

Save and exit the Block Editor, choose the Dynamic Block, you will find that one grip has disappeared. In fact, after changing the number of grips from “2” to “1”, the first thing that disappeared was the basic grip of parameters, namely the first point when adding parameters.
Angle Offset

Angle Offset
Open Block Editor, choose the Angle offset from 0°to 30°in the action property, save and exit the block editor

Select the Dynamic Block and then move the right side grip. You will find it can only move in the direction of 30°as it is shown in the follow picture. The direction of action can change according to the Angle Offset.
Linear Stretch
During a mechanical design, we often need to change the position as well as the dimension of the keyway. In this section, we will add Linear Tensile function for the keyway on the step shaft.

- Add linear parameter:


-
Add stretch action: Click the stretch action button on the action panel, choose parameter according to prompt and define right grip as key parameter point, as shown in below picture. The black object is the operational object of the action, the broken line frame is the stretch frame, objects intersect with stretch frame will be stretched, objects which will be selected by the stretch frame will move.
-
Test dynamic block: Exit from block editor, drag stretch grip to stretch the keyway, as shown in the picture.
Parameter Value Set
For mechanical designs, we often need to stretch the keyway to a certain length. Now, let us see how to realize an accurate stretch. Pick linear parameter in block editor, click entry frame which is on the right side of" distance type" on the Properties panel, a drop-down menu will pop up.

Therein, none is the default option, which means it can stretch optionally. With the other two options, you can define the maximum and minimum number respectively.


"Increment" means stretch increasingly, a Value set appears as shown below after selecting increment. If you choose "list", a Value set appears as shown in below picture, the dynamic block can only be stretched according to the number in the list.

Click the text frame which is on the right side of the "distance value list", one button with ellipsis on it will appear. Click this button, a "Add distance" dialog box will be displayed. Add three numbers “1”.“1.5”.“2” in the dialogue box, as shown in below picture.
Exit from block editor and stretch the right grip, you will see several gray lines appearing on the right side of the keyway, and the keyway can only be stretched to the gray line position, as shown in below picture. Obviously, by value list, you can define certain numbers of the stretch, to realize an accurate stretch.

Symmetrical Stretch

Symmetrical Stretch
There is an easy way to realize the two-way stretch which is adding two actions of stretch. Though it can realize a two-way stretch, the action of stretch is independent. The parameter needs some additional setup to realize the two-way symmetrical stretch.
-First, add two stretch actions for parameter, and select the two grips of the two parameters as the relevant point of each action.

-Second, in the misc, modify the base location from "Start Point" to "Mid Point", like shown in the picture below. Save and exit the block editor.
For the convenience of watching the effect, we drew a vertical center line in the middle of the keyway, and then stretched the grip to the left side of the keyway or the right side, as shown in the picture below. As the grips are moving, the two-way symmetrical stretch is realized.

Distance Multiplier
Take the step shaft as an example, if we stretch the left part of the step shaft and the keyway still is at the center point of the smaller diameter shaft after stretching. Then, we use the “Distance Multiplier” property of action to achieve the aim.

- Add linear parameter and stretch action for step shaft: Hide the right grip of the parameter point, the action stretch box is as in the following picture, the bolded object is the action operation object.

- Add Move Action for keyway: Select the left grip of the linear parameter when moving, stretching the related parameter points. Move the objects of action and select the whole keyway, as in the following picture.

- Modify distance multiplier of action: Select Move Action and modify the default value from 1 to 0.5 in the property of the distance multiplier, save and exit the block editor.

4.Test Dynamic Block: Stretch leftwards grip and with the grip moving leftwards, the smaller diameter shaft will appear with a stretch effect, the keyway will also move leftwards accordingly, meanwhile, the keyway is in the center of the smaller diameter shaft of the step shaft all the time. Although Stretch and Move have a common parameter, when the Distance Multiplier of Move is modified to 0.5, the displacement of Move can only stretch 0.5 times of the displacement.
Chain Action
If you want to realize a symmetric stretch without changing the keyway center and the length of smaller diameter shaft changes with the stretch at the same time, how can you realize that?

- Add stretch for Step Shaft: Add stretch parameter and action for step shaft as the following picture shows. There into, the bolded objects indicate the operation object of action. Because the follow-up operation will not stretch the step shaft by grips of this linear parameter, the grip’s number of the linear parameter can be modified to “0”.

- Add linear parameter for keyways: Set the base point position of the line parameter as “Center” in order to realize the symmetric stretch function.
3.Add the stretch rightwards action for the keyway and realize chain action: Select the “Distance” linear parameter and modify the chain action of prosperity from “NO” to “Yes” as the following picture shows:


Add the Stretch Leftwards action for keyway as the following picture shows. Special Note: Do elect “Distance” for the linear parameter to stretch leftwards the operation objects set. This is a necessary procedure of the chain operation.

4.Test Dynamic Block: After dragging the left grip, not only the keyway will stretch bi-directionally and symmetrically but also the smaller diameter shaft of the step shaft will stretch automatically. This is a chain action. The realization of a chain action has two important procedures: First, modify the property value of the parameter that need to happen as linkage and modify the property of “chain action” from “NO” to “YES”. Second, elect the parameter of objects that are elected to linkage action to set.
Scale Action
Scale Action can be matched with the Linear Parameter, Polar and XY Parameter to achieve various Dynamic effects.

Linear Scale
-
Draw: Finish drawing an access hole in a model space and define it as a block, as shown in the following picture.
-
Add Linear Parameter: Enter into Block Editor to add a linear parameter. The start point of the Linear Parameter is the center of the circle, and choose the number of grip as “1”as shown in the following picture.


- Add Action: Click the Scale icon on the Action Panel, appoint parameter for Action and box the whole access hole as Action Object, as shown in the following picture.

- Test Dynamic Block: Exit from Block Editor and insert the Dynamic block, after pitching up the Dynamic Block, drag the triangle grip, the objects (nuts) will scale with it.

Polar Scale
When we move the Scale Grip of the Access Hole on the left of circle center, namely move the base point of the Linear Parameter to the left of the circle center, we will find that the block does not have a corresponding Scale, as shown in the following picture.

The reason for this is that the Endpoint of the Linear Parameter cannot cross its base point, so we change the Linear Parameter to be a Polar Parameter, we do not change any other operations, as shown in the following picture.

Exit from Block Editor, Drag the grips of the Access hole Block again, you can see, that after the change from Linear Parameter to Polar Parameter, we can drag the grip to scale the dynamic block in any direction.
Scale Character
In this section, we will explain some Scale characters using XY Parameter and Scale Action in a paired example.
- Drawing graphics: Draw the graphics which need a dynamic block and define them as a block as below:

- Add XY Parameter: Entry Block Editor, add XY Parameter. Parameter adding is similar to Linear Parameter. Pick the first point of the parameter from the left bottom corner of the rectangle as the base point, the second point from the top right corner and change the Number of Grips to “1”. Then add Scale Action, as shown below.


- Test the Dynamic Block: After exiting the Block Editor, drag the grip of the top right corner of the rectangle, you can see the whole dynamic block is scaling as the grip is moving. It is easy to find that both the circle and the rectangle scale by the base point of the XY Parameter.

- Modify Action Base: Modify Base type: go back to Editor, select Scale Action and change the default “Dependent” to “Independent”.

Specify new base: Single click the right input box of “Base-X” and “Base-Y”, you can manually input the coordinate value or you can single click the small button with ellipsis dots on the right of the input box and snap the base point, as shown:

Specify the base point by crosshair and the circle center as base point. After exiting Block Editor, scale the dynamic block. After modifying Base type and position, the scale center of the dynamic block changes from the XY Parameter base point to the new specified base point (center of the circle).

- Scale Type: There is “Scale Type” in the Scale Action Properties. The default value is “XY Scale”. If you choose “XY Scale”, the dynamic block scales whenever the scale grip moves to X axis or Y axis. If you choose “X Scale”, it scales only when the grip of the scale moves to X axis. Same, when you choose “Y Scale”.
Rotation

Rotation
In this section, we are going to use a rotation parameter and rotate action to add a dynamic rotate function to view index symbols (English system) which are frequently used in architectural drawings.
-
Draw a drawing: Draw a view index symbol and define as a block, as shown in below picture. Please define view number and drawing number as attribute text, so as to revise whenever you want.
-
Add rotation parameter: Pick the center of the circle as the first point of the parameter, system default it as the rotation point, set angle type as "increment", and define its number as 15 degree, as shown below.


- Add rotate action: Click the rotation action button on the action panel, match parameter, object and position for the action and select the whole index symbol as the object of the action.

- Test dynamic block: Exit from block editor and insert the block, drag rotation grip to reach the effect of rotation, as shown in below picture.
Polar Stretch
We use the Polar Stretch function of Dynamic Blocks to draw the section symbol in this section.
- Draw, Mirror and Define as a Block: The follow drawing includes the attribute text which can be modified as you need. Then mirror this drawing and define the mirrored object as a block.


- Add action and parameter for the attribute text: Add Point Parameter and Move Action for text and change the Chain Action to “Yes” .It is ready for next step to create Chain Action for Polar Stretch Action.

-
Add Polar Parameter and Action: Add Polar Parameter whose first point should be the center of the section symbol. This point will be the rotation center of the Polar Parameter. Follow the instructions below:
-
Pick the right grip of the Polar Parameter as an associated parameter point and specify the Stretch box (Fig. 3.1).
-
Select objects to stretch and the “position” Point Parameter together, which can accomplish that the text and section symbol are moving together (Fig. 3.2).
-
Specify objects which rotate only for Polar Stretch Action (Fig 3.3).
-
Specify Action symbol location (Fig 3.4)
-
Repeat the above steps to add the same parameter and action order for the left part.


Fig 3.1 Fig 3.2


Fig 3.3 Fig 3.4
It is better if you hide the grips which are not associated with the Polar Stretch Parameter as below:

- Test Dynamic Block:


Open the graphic which needs to be dimensioned and insert the completed dynamic block (Fig 4.1).
Drag the grip of the dynamic block, the section symbol can be stretched outward and rotated around the center, and you finish the section symbol mark (Fig 4.2).
Fig 4.1 Fig 4.2
Polar Stretch Action Characteristics

Polar Stretch Action Characteristics
Modify the grips’ number of the polar parameter in the section symbol dynamic block in the last example to display both of the two grips of the polar parameter. From the following picture we can see that the central grip is clearly different before and after. Before modifying, the central point was actually the base point of the block, and this was the insert point. But after modifying, the center point of block is the base point of the polar parameter.

Clicking central grip can move the grip to any direction. Meanwhile, the dark blue insert point of block will appear again, as shown in the following picture. Obviously, the insert point is only covered by the base point of the polar parameter. The base point of the polar parameter can move arbitrarily, but for the block it seems that no change is happening. But is it true?

In order to confirm if the block changes or not, we move the grips on both terminals and we can find that the section symbol does not center on the dark blue base point when changing but it takes the base point of the polar parameter as a rotate center, as shown in the following picture.
Enter block editor, move up the parameter and the other settings do not change.


Exit block editor, move the right grip and you can see that rotate center moves up along with the parameter. From the examples above it is difficult to understand that the polar parameter cannot move arbitrarily like the point parameter and linear parameter, the reason is that the base point of the polar parameter specifies the rotate center of the object, once the parameter is moved, the rotate center will move accordingly. That the rotate parameter cannot move arbitrarily has the same reason.
Array
For the Array function of Dynamic Block we need to use Array Action, we use Array Action to match with Linear Parameter, Polar Parameter, XY Parameter to achieve various Arrays.
Linear Array
- Draw: Draw a parts list and define it as a block.

- Add Linear Parameter: After adding Array Action, we can drag the two grips of the Parameter to make a list array, but obviously, we hope just to achieve an up array of the blank bar, not a down array, so to avoid a mistakes, we should hide the grip under the Parameter, as in the following picture.

- Add Array Action: During the add Array Action, the system will require to appoint space between columns. The space between columns is the distance between the objects that the array created. Here, the line width is 7mm, for the line between the lines a close up array can be chosen, we appoint that the space between the columns is 7mm.

- Test Dynamic Block: Insert Dynamic Block, drag the top right corner grip upwards, the line number of the part list will be added automatically, as in the following picture.


XY Array
Compared with Linear Array, XY Array has a vertical direction Array.

Polar Array
We see a Dynamic Block example as follows, after dragging grip, the effect will be as in the following picture. You can see, not only can we stretch the fence, but we can also rotate the direction casually, this is the effect combining Polar Stretch with Polar Array.

Enter into Block Editor; stretch, the ways of adding Array Action as shown in the following picture, the bold object expresses the relevance with the selected action. The Polar Parameter determines the way of Array directly, the Polar Array will regard the direction of the Polar Parameter as Array direction, achieving Array functions in any direction.
Parametric Constraints
Geometric constraints manage how objects relate to others, enabling automatic adjustments to other objects when changes are made. They also restrict changes to distance and angle values, ensuring design precision.
There are 12 types of geometric constraints corresponding to 12 relationships: Coincident, Collinear, Concentric, Fix, Parallel, Perpendicular, Horizontal, Vertical, Tangent, Smooth, Symmetric, and Equal.
This feature is only available in the GstarCAD 2025 Plus version.

Coincident
Constrains two points to coincide, or a point to lie anywhere on an object or the extension of an object.
- Access: Click Ribbon
Parametric
Geometric

or enter GCCOINCIDENT command.
-
Command Prompts:
-
Select the first point or [Object]: Select the first point or object that needs to coincide.
-
Select the second point or [Object]: Select the second point or object that coincides with the first point or object.
-
-
Example:

Collinear
Constrains two lines to lie on the same infinite line.
- Access: Click Ribbon
Parametric
Geometric

or enter GCCOLLINEAR command.
-
Command Prompts:
-
Select the first object or [Multiple]: Select the first object orc multiple objects that need to be collinear;
-
Select the second object or [Multiple]: Select one or multiple objects that are collinear with the first object or the group of objects.
-
-
Example:

Concentric
Constrains selected circle, arcs, or eclipses to maintain the same center point.
- Access: Click Ribbon
Parametric
Geometric

or enter GCCONCENTRIC command.
-
Command Prompts:
-
Select the first object: Select the first object that needs to be concentric;
-
Select the second object: Select the second object that is concentric with the first object.
-
-
Example:

Fix
Constrains a point or a curve to a fixed location and orientation relative to the World Coordinate System.
- Access: Click Ribbon
Parametric
Geometric

or enter GCFIX command.
-
Command Prompt:
- Select point or [object]: Select the point or object that needs to be fixed;
-
Example:

Parallel
Constrains two lines to maintain the same angle.
- Access: Click Ribbon
Parametric
Geometric

or enter GCPARALLEL command.
-
Command Prompts:
-
Select the first object: Select the first object that needs to be parallel;
-
Select the second object: Select the second object that is parallel with the first object.
-
-
Example:

Perpendicular
Constrains two lines, or polyline segments to maintain a 90-degree angle to each other
- Access: Click Ribbon
Parametric
Geometric

or enter GCPERPENDICULAR command.
-
Command Prompts:
-
Select the first object: Select the first object that needs to be perpendicular;
-
Select the second object: Select the second object that is perpendicular with the first object.
-
-
Example:

Horizontal
Constrains a line or pairs of points to lie parallel to the X-axis of the current UCS.
- Access: Click Ribbon
Parametric
Geometric

or enter GCHORIZONTAL command.
-
Command Prompts:
- Select an object or [2Points]: Select the object or two points that needs to be parallel to the X-axis.
-
Example:

Vertical
Constrains lines or pairs of the points to lie parallel to the Y-axis of the current UCS.
- Access: Click Ribbon
Parametric
Geometric

or enter GCVERTICAL command.
-
Command Prompts:
- Select an object or [2Points]: Select the object or two points that needs to be parallel to the Y-axis.
-
Example:

Tangent
Constrains two curves to maintain a point of tangency to each other or their extensions.
- Access: Click Ribbon
Parametric
Geometric

or enter GCTANGENT command.
-
Command Prompts:
-
Select the first object: Select the first object that needs to be tangent;
-
Select the second object: Select the second object that is tangent with the first object.
-
-
Example:

Smooth
Constrains a spline to be contiguous and maintain G2 continuity with another spline, line, arc, or polyline.
- Access: Click Ribbon
Parametric
Geometric

or enter GCSMOOTH command.
-
Command Prompts:
-
Select the first spline curve: Select the first object that needs to be smoothed;
-
Select the second object: Select the second object that satisfies G2 continuity with the first object.
-
-
Example:

Symmetric
Constrains two curves or points on objects to maintain symmetry about a selected line.
- Access: Click Ribbon
Parametric
Geometric

or enter GCSYMMETRIC command.
-
Command Prompts:
-
Select the first object or [2Points]: Select the first object that needs to be parallel;
-
Select the second object or [2Points]: Select the second object that is parallel with the first object.
-
Select symmetry line: Select the axis of symmetry.
-
-
Example:

Equal
Constrains two lines or polyline segments to maintain equal lengths, or arcs and circles to maintain equal radius values
- Access: Click Ribbon
Parametric
Geometric

or enter GCEQUAL command.
-
Command Prompts:
-
Select the first object or [Multiple]: Select the first object(s) that need(s) to be equal;
-
Select the second object or [Multiple]: Select the object(s) equal to the first object.
-
-
Example:


Show/Hide (CONSTRAINTBAR): Select objects to display or hide their associated geometric constraints.

Show All: Display all geometric constraints.

Hide All: Hide all geometric constraints.

Delete Constraints (DELCONSTRAINT): Delete all constraints that are associated with the selected objects.

Constraint Settings (CONSTRAINTSETTINGS): Manage settings related to constraints


You can also use GEOMCONSTRAINT command to establish or maintain geometric relationships between objects or points on objects.
The order and selection points of objects can influence their relative positions when applying a geometric constraint to a pair of objects.
Each option of this command corresponds to an individual command from (1) to (12).
Parametric Constraint Related System Variables
| System Variable | Description | Value | Value Description |
|---|---|---|---|
| CONSTRAINTBARDISPLAY | Controls the display of constraints bars for subsequently applied geometric constraints, as well as the display of hidden constraints for selected objects. | 0 | Automatically hides constraint bars after applying geometric constraints. |
| 1 | Displays constraint bars when objects are geometrically constrained. | ||
| 2 | Displays any hidden constraints, but only if the constrained objects are selected. | ||
| CONSTRAINTBARMODE | Controls the display of geometric constraints on constraint bars. Setting it as 4095 could display constraint bars for all constraint types | 1 | Horizontal |
| 2 | Vertical | ||
| 4 | Perpendicular | ||
| 8 | Parallel | ||
| 16 | Tangent | ||
| 32 | Smooth | ||
| 64 | Coincident | ||
| 128 | Concentric | ||
| 256 | Collinear | ||
| 512 | Symmetric | ||
| 1024 | Equal | ||
| 2048 | Fix | ||
| CONSTRAINTINFER | Controls whether the geometric constraints are inferred while creating and editing geometry. | 0 | Off |
| 1 | Geometric constraints are inferred | ||
| CONSTRAINTNAMEFORMAT | Controls the text format for dimensional constraints. | 0 | Name (for example, Width) |
| 1 | Value (for example, 4.0000) | ||
| 2 | Expression (for example, width = 4.0000) | ||
| CONSTRAINTSOLVEMODE | Controls constraint behavior when applying or editing constraints. | 0 | Does not maintain the geometry’s size when a constraint is applied or edited |
| 1 | Maintain of the geometry’s size when a constraint is applied or edited | ||
| CBARTRANSPARENCY | Controls the transparency of the constraint bars. | 50 | The valid value ranges from 10 to 90. Higher value makes the constraint bars more opaque. |
Share Date between Applications
Net Framework Support
.NET API enables you to manipulate the application and drawing files programmatically with libraries that are exposed and can be accessed by many different programming languages such as VB.NET, C# and Managed C++.etc. Users are able to automate tasks such as creating and modifying objects stored in the database of a drawing file or change the contents of a customization file.
ObjectARX API
GstarCAD 2025 GRX is compatible with AutoCAD ObjectARX 2020 APIs, programs can be successfully compiled, loaded and used without editing code, which saves a lot of time in migrating applications developed with AutoCAD ObjectARX.
Copylink Command
Using COPYLINK command, Users can copy the current drawing view to the Clipboard and then paste the contents of the Clipboard into another document as a linked OLE object.
Lisp Debugger

You can enter the VLISP or VLIDE command, or click Ribbon
Manage
Applications
Visual LISP Editor to launch the Visual Studio Code as the Lisp Debugger in GstarCAD 2025, in which you are able to edit, and debug Lisp programs conveniently.
If you haven’t installed the Visual Studio Code software, a warning will pop up, asking you to install it first.

If the Visual Studio Code software has been installed in your PC, it will be opened in a few seconds. You can visit VS Code official website (https://code.visualstudio.com/docs/getstarted/userinterface) to learn more details.
GstarLisp:This extension adds support for Lisp files to Visual Studio Code. It allows you to edit and debug your lisp programs with GstarCAD. When you start VS Code through GstarCAD, it will install the GstarLisp extension for you by default. And when there is a new version of the GstarLisp extension, it will be updated automatically the next time you start VS Code through GstarCAD. Or, you can also search and install it in marketplace.
- Open File

You are able to open LSP files or DCL files and debug them when the VS Code is opened and GstarLisp extension is installed.
-
Click the GstarLisp extension icon, then click "Open Folder" icon, select the folder, and the .lsp and .dcl files will be filtered out.
-
Click the file in the list to open it in the editing area.
-
Click the refresh button to reload the selected file if you need.

- Edit File
What you can do to edit the program with GstarLisp extension in VS Code:
-
Syntax highlight
-
Code folding
-
Smart hints
-
Autocompletion
-
Code snippets
- Debug
Basic debugging steps include:
-
Step 1. Launch VS Code
-
Step 2. Open a LSP file or a DCL file
-
Step 3. Add debug configurations and edit launch.json
-
Step 4. Choose a debug configuration: GstarLisp-Launch or GstarLisp-Attach
-
Step 5. Click Run>Start Debugging (or Press F5)
GstarLisp-Attach:
Allows you to attach to a running instance of the GstarCAD application to debug the current LSP or DCL file.

As long as you choose GstarLisp-Attach configuration, you need to select a running GstarCAD instance as debug adapter. If there is no running GstarCAD instance in your PC, a warning will pop up, and the file can’t be debugged.


GstarLisp-Launch:
Launches a new process of the GstarCAD application to debug the current LSP or DCL file.

As long as you choose the GstarLisp-Launch configuration, you need to specify the absolute path of the gcad.exe file in the extension settings of the GstarLisp extension (path format C://Program files//Gstarsoft//GstarCAD2023//gcad.exe)

If you haven’t set an absolute path to the gcad.exe file, the debug window will prompt you to set the path.


- Debug Actions

Once a debug session starts, the Debug toolbar will appear on the top of the editor.
-
Continue / Pause: Jumps to next breakpoint.
-
Step Over: Completes current line and moves to the next line of code in the current function.
-
Step Into: Completes the next line of code. If this line contains a function, go to the first line of the function's code and stop.
-
Step Out: Completes all the code in the current function and return you to the previous function that "called" this function.
-
Restart: Restart the debug session.
-
Stop: Stops the debug session.
- In GstarLisp, press F10 to complete current line and move to the next line of code, while in AutoLisp, press F10 to complete current line, and then press F10 to move to the next line.
-
When you click the Restart icon:
-
GstarLisp-Attach configuration: Current debugging session will not be stopped, and the debugging will be restarted in the current CAD instance.
-
GstarLisp-Launch configuration: Stops the current debugging session, end the current CAD instance (without asking whether to save the drawing), and then re-launch a new CAD instance for debugging.
-
When you click the Stop icon:
-
GstarLisp-Attach configuration: Stops debugging session, but keeps current CAD instance.
-
GstarLisp-Launch configuration: Stops debugging session, end the current CAD instance (without asking whether to save the drawing).
- Run View
Once a debug session starts, the Run View windows will appear on the left of the editor, include:
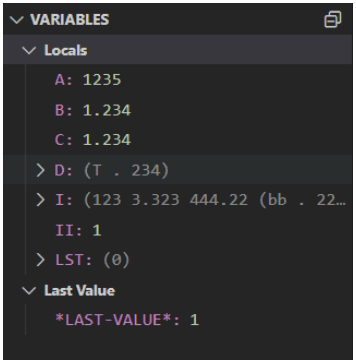
VARIABLES
The Locals and Last Value windows show variable values while you are debugging. The windows are only available during a debugging session. The Locals window shows variables defined in the local scope, which is usually the current function or method. The Last Value displays the value of the last changed variable.
- WATCH

While you're debugging, you can use Watch windows to watch variables and expressions. The windows are only available during a debugging session. Watch windows can display several variables at a time while debugging. You are able to add, edit or remove expressions by right click on the Watch windows.
CALL STACK
The Call Stack windows display a list of all the procedures that have been executed. It lists the name of the function or procedure that is currently on the stack. In GstarLisp, the call stack mainly displays the name of the called function.
BREAKPOINTS
A breakpoint is a setting that you can add to a line of code to temporarily pause the execution at that line. Breakpoints can be toggled by clicking on the editor margin or using F9 on the current line. The Breakpoints windows allow you to control all breakpoints.
Python

GstarCAD continuously enhance the integrity and compatibility of GRX, .NET, and LSP, ensuring that users' secondary development programs run smoothly after migration, thereby reducing the cost of secondary development migration.
In GstarCAD 2025, we support the use of Python on Windows to extend the capabilities of the GstarCAD platform. With over 790 commonly used Python interfaces, we cover daily usage scenarios, such as creating custom commands, custom graphics and entities, accessing and modifying various drawing data, and implementing custom drawing and analysis algorithms. Users can leverage Python's powerful features for custom development and automation, significantly expanding GRX functionality. This script-based invocation of GRX interfaces supports cross-platform development and lowers the learning cost for new developers.
System Environment Requirements
-
Python 3.11.8
-
Windows 10 and above
Install Python
Download the installation package and install it as administrator, configure the options as below:


Import Interface
Use the Import command in the Python file to import the secondary development package:
from pygcad.core import *
from pygcad.pygrx import *
pygcad.core includes Python-specific core interfaces such as the @command decorator;
pygcad.pygrx contains various types and methods corresponding to GRX interfaces.
Register Custom CAD Commands
During development, when a user-defined function is decorated with @command, this function is automatically registered as a command in GstarCAD, with the function name as the default command name. For example:

The function pyDrawLine() is decorated with @command(), automatically registering it as the GCAD command PYDRAWLINE.
If you don't want to use the function name as the command name, you can specify it in the decorator function command(). The @command decorator is defined as follows:
def command(local_name="", global_name="", group_name="", cmd_flags=0):
When local_name is empty, the name of the decorated function is automatically used as local_name. If global_name is empty, it automatically uses local_name as global_name. If group_name is empty, it selects global_name as group_name. For example:

This defines a custom command: PY_MY_CMD.
Load in GstarCAD
For example, we used the secondary development interface to develop our own PYMKENTS command. Python file is: ents.py. After running the command, the program will draw a line, a circle with a red linetype, and create a layer named ASDK_MYLAYER.
- Open GstarCAD 2025, enter the APPLOAD command, the Load/Unload Applications dialog box will pop up:

- Click Load button and select the ents.py file, it will register the command automatically: PYMKENTS

- Close the dialog box and enter command PYMKENTS, the program automatically runs.
Security
SECURITY
SECURITY command sets the system security monitoring level, and display or delete the current trusted publisher certificate. Unnamed VBA project files can be loaded without warning.

Security Options in Save As
Users could add security options for the specified drawing file, those options will have effect when saving the drawing. Anyone who wants to open the drawing file needs to input the correct password. Do remember the password, otherwise, the drawing can't be recovered.


Digital Signature
DIGITALSIGN and SIGVALIDATE command are provided to support attaching and validating digital signatures, which can offer reliable information, and validate the authenticity and integrity of drawings.
| System Variable | Description | Value | Value Description |
|---|---|---|---|
| SIGWARN | Controls whether the Digital Signature Contents dialog box is presented when a file with a valid digital signature is open | 0 | The information is not presented if a file has a valid signature |
| 1 | The information is presented if a file has a valid signature |
Display digital signature information: Located at Logo
Options
Open and Save
File Safety Precautions
Display digital signature information, has the same effect as the SIGWARN system variable.


If your digital signature has a password, you will need to enter the password first.
The digital signature will become invalid when:
-
The file is modified after the digital signature is attached.
-

The file is damaged during transmission or when a digital signature is attached.
- The digital certificate has been revoked by its certificate authority.
DIGITALSIGN

You can enter DIGITALSIGN command to attach a digital signature to a drawing, which can provide reliable information of the origin, identity and status on a drawing file. And if an unauthorized change is made or the signed file is corrupted, the digital signature becomes invalid.
After execute the DIGITALSIGN command, the Security Options window will pop up, after checking the ‘Attach digital signature after saving drawings’ option, you are able to select a digital ID and edit signature information (Time stamp and Comments).


But, if there is no valid digital certificate in your PC, a warning box will pop up.
Except the DIGITALSIGN command, you can also enter ‘SAVEAS’ command, or click Logo
Save as
Security Options, to open the ‘Save drawing as’ dialog box and attach a digital signature to the drawing. The Security Options window that is popped up is the same as DIGITALSIGN command.

You can only digitally sign the following file types:
-
DWG and DWT files that are compatible with AutoCAD 2000 and later drawing-file formats.
-
DWS files.
DWFX Batch Digital Signing Tool
You can find the application digitalsign.exe in the program installation path to signs DWFX, DWG and DWT files in bulk with digital signatures efficiently.
In the Attach Digital Signatures dialog box:

-
Files to be signed: Displays a list of files added to be signed with their folders and status(empty, signed, previously signatures). The number of files you added will also show at the left-bottom of the list.
-
Add Files: Pops up the Select File dialog box, and you can select the files you want to attach a digital signature to.
-
Search Folders: Pops up the Browse for Folder dialog box, you can select the folder of files you want to attach a digital signature to and then click OK.
-
Remove: Removes the selected files from the list
-
Clear List: Empties the whole file list
-
Select a Digital ID (Certificate): Select a digital ID to attach to the files you selected in the Files to Be Signed list.
-
Get Time Stamp From: Select a time service if you want to add a time stamp to the signed files.
-

Comment: Add any extra description to the files you are signing.
-
Sign Files: Starts the signing process, it will pop up a Signing Complete dialog box after finishing and display the Number of files signed.
-
Close: Close the Attach Digital Signatures dialog box.

If the file you want to sign is read-only, the Read-only File dialog box will be displayed, you can select according to your needs.
If you choose either a Medium or High-security level when you obtained your digital ID, a message will be displayed each time you try to attach a digital signature to a file.
Right-Click Menu:

-
Delete: deletes the selected file
-
Properties: Pop up the system Properties window
-
Signature information: Pop up the View the signature details window


SIGVALIDATE
You can click the signature validate icon in the Status bar or enter the SIGVALIDATE command to figure out whether the digital signature attached to a drawing file is valid or invalid. The Validate Digital Signatures dialog box that shows information about the digital signature is displayed.


After executing the SIGVALIDATE command, the Validate Digital Signature dialog box pops up. When it is valid:
Name: Displays the location and name of the file whose digital signature is being viewed.
Digital Signature Status: Displays a Valid Signature icon if a digital signature is valid, and an Invalid Signature icon if the digital signature is not valid.
View Base Signature: Displays the Digital Signature Contents dialog box. The option is available only if the digital signature is valid.
View Xref drawings: Displays the Xref drawings contained in a file’s base drawing. After checking it, a list of Xref drawings will be showed below as long as there are some Xref drawing contained in the current signed file.
View Xref Signature: Displays the Digital Signature Contents dialog box of the Xref file. It can be clicked only if the Xref file is selected in the list.

The Digital Signature Contents dialog box includes;
-
Name: Displays the location and name of the file whose digital signature is being viewed.
-
Digital Signature Status: Displays a Valid Signature icon if a digital signature is valid, and an Invalid Signature icon if the digital signature is not valid.
-
Signed by: Displays the location and name of the file whose digital signature is being viewed.
-
Other fields: Displays the subject, issuer, valid from date, valid to date and serial number in the Values box.
-
Subject: Displays information about the organization or individual who owns the digital ID and attached the digital signature.
-
Issuer: Displays the name of the certificate authority that originally issued the digital ID.
-
Valid from: Displays a day, month, year, and exact time, the digital ID is valid from that time.
-
Valid to: Displays a day, month, year, and exact time, the digital ID will be invalid after that time.
-
Serial numbers: Displays the serial number assigned to the digital ID.
-
Values: Displays information about a digital signature based on the item you select in the Other fields drop-down list.
-
Comment: Displays comments about the digital signature that is attached to the current file.
-
Signature date and time:Displays the date and time that the digital signature was attached to the current file. The date and time are based on the time service used when the signature was attached.
-
Time service used:Displays the time service used to add the time stamp to the current file.
-
Close:Closes the dialog box.
-
Help:Opens Online Help system, Home – Commands – S – SIGVALIDATE command.
When the drawing file is not signed:

BIM Support
IFCIMPORT
You can enter IFCIMPORT command or click Ribbon
BIM
Open IFC Files to import an IFC file with complete BIM data.


After opening an IFC file, you can select an entity and go to the Properties Panel to its BIM information.

You can also check and manage the entities using Structure Panel, which displays a tree structure of entities based on BIM data.
You can execute operations by clicking buttons on Ribbon
BIM, or entering the following commands.

-
STRUCTUREPANEL: Open structure panel
-
STRUCTUREPANELCLOSE: Close structure panel
-
STRUCTUREPANELUPDATE: Update structure panel
Structure Panel Menu: Displays the Structure Panel main menu.
-
BIM: Displays a BIM entity-based structure.
-
Configure structure tree: Opens the Configure Structure Tree dialog box, which allows you to set the structure tree configurations.
-
Select Configuration…: Allows you to load Structure Tree Configuration Files (*.gst).


Structure Panel right-click menu: It is used to manage the entities, you could complete operations including show, hide, isolate, zoom, expand all, collapse all and open the configuration panel.

Configure structure tree: Allows users to define the tree structure of the Structural Panel.
-
File:
-
Open…: select to open another *.gst configuration file.
-
Save: saves the current configuration
-
Save as: saves the current configuration under a different name
-
Group/Sort
-
Add: Adds a new rule or property
-
Select an existing rule, then click the Add or right-click and select Add Rule in the right-click menu.
-
The new rule will be added below the selected rule.
-
Right-click the new rule and click Rename in the right-click menu and input a new name.
-
Select the Filter node of the new rule, then click the Add or right-click and select Add filter property.
-
Select the Group node of the new rule, then click the Add or right-click and select Add Grouping Property.
-
Select the Sort node of the new rule, then click the Add or right-click and select Add sorting property.
-
The Select Property dialog box pops up, select a property, then click.
-
-
Delete: deletes the selected rule or property.
-
Move Up: moves the selected rule or property up.
-
Move Down: moves the selected rule or property down.
-
Toggle negations: filter properties only
-
Show/Skip:
You can pick an option and then select the entity types which you want to follow the option you pick.
-
Options:
-
The drop-down list is to select what happens in the model space when entities are selected in the Structure Tree.
-
The checkboxes are to select what happens in the structure tree when an entity is selected/deselected in the model space. The following options are checked by default: On entity selection, select in tree; On entity selection, expand parent in tree; Deselect entities on hide.


On the basis of IFC Import, you can now export IFC files and import RVT files with complete BIM data, and STEP/IGES module will be included in GstarCAD installer, you don't need to install it separately.
IFCEXPORT
On the basis of IFCIMPORT, now you can enter IFCEXPORT command or go to Ribbon
BIM
Export IFC files to export drawings in IFC format with their complete BIM data.

Besides, there’s also a newly added system variable for handling IFC files in GstarCAD:
| System Variable | Description | Value | Value Description |
|---|---|---|---|
| SHOWALLIFCENTITIES | Controls the display and hiding of entities in IFC files that are not associated with building entities. | 0 | Hides entities in the IFC drawing that are not associated with building entities. |
| 1 | Displays entities in the IFC drawing that are not associated with building entities. |
RVTIMPORT
You can enter RVTIMPORT command or go to Ribbon
BIM
Open RVT files to import drawings in RVT format with their complete BIM data.

STEP/IGES Files Support
STEP (Standard for the Exchange of Product Model Data) is an international standard established by the International Organization for Standardization (ISO) that defines how product information is represented and exchanged throughout the entire product lifecycle. The file formats include .step, .stp, and .ste.
IGES (The Initial Graphics Exchange Specification) is a general ANSI information exchange standard based on CAD (Computer-Aided Design) and CAM (Computer-Aided Manufacturing) systems. The file formats include .igs or .iges.
GstarCAD 2025 supports the import of STEP/IGES files, enhancing our platform's capability for 3D model data.

You can go to GstarCAD logo
Open, or GstarCAD logo
Import
Other Formats, and select STEP/IGES in the drop-down list of Files of types to open or import STEP/IGES files. Besides, you could also simply enter IMPORT, STPIMPORT or IGSIMPORT command.
Innovative Features
Line Enhancement
ANGLE (A) option is added for line command, with this option you can get a fast way to draw a line without assistance of the polar or a xline. You can directly input the angle value refers to X axis as well as you can take other line as reference to input the angle value and even you can input the angle value directly refers to previous line.

Practice example:

To draw the red line in Figure 1-1, the steps as below:
- Execute line command
- Specify first point:
- Specify next point or [Angle/Length/Undo]:a
- Specify angle [Reference] <0>:35(Software will take the X axis as reference)
- Length of line: 500

To draw the red line in Figure 1-2, the steps as below:
- Execute line command
- Specify first point:
- Specify next point or [Angle/Length/Undo]:a
- Specify angle [Reference] <0>:r
- Select a line object: (Please select the reference line)
- Specify an angle: 38 7. Length of line: 500
To draw the red line in Figure 1-3, the steps as below:
- Execute line command (to draw the line 1).
- Specify first point:
- Specify next point or [Angle/Length/Undo]: l
- Specify length: 300
- Specify next point or [Angle/Length/Undo] (to draw the line 2): a
- Specify angle [Reference/reference to Previous/Included angle] <0>: p(Here you can try reference to Previous option which will take the extension of the previous line as reference)
- Specify an angle: 127
- Length of line: 500
- Specify next point or [Angle/Length/Closed/Undo]:a (to draw the line 3)
- Specify angle [Reference/reference to Previous/Included angle] <0>: I (Try Included angle option)
- Specify an angle: 37
- Length of line: 400
Polyline Enhancement

Polyline Enhancement
The ANGLE (A) option in polyline command which its behavior is similar as the one in line command is also added in Polyline. There are still three choices for angle option, you can either input angle value which takes X Axis as reference as well as you can input “reference to Previous” angle or “Included angle”. In CAD software, many objects are consisting of Polyline, for example: rectangle, polygon and revision cloud, donut. Now these functions are classified under the Polyline drop down list where you can access them quickly.
Rectangle Enhancement
OBLIQUE(O) is a new added option to draw an rotate rectangle. The behavior of oblique option is similar as the behavior in line command. With oblique option, you can locate the angel of bottom line and the length to get a rotate rectangle, you can draw an oblique rectangle which has specific angle with X axis and horizontal or has random angle refer to any line.

Practice example:
To draw the rotate rectangle in Figure 1-4, the steps as below:
- Execute RECTANG command and input oblique option or click the rotate rectangle icon in ribbon panel.
- Specify first point:
- Specify next point or [Angle]: a(Input Angle option)
- Specify angle [Reference] <0>:20
- Enter rectangle width: 800
- Enter rectangle height: 350

To draw the rotate rectangle when there is a reference line in Figure 1-5, the steps as below:
- Execute RECTANFG command and input oblique option or click the rotate rectangle icon in ribbon panel.
- Specify first point:
- Specify next point or [Angle]a
- Specify angle [Reference] <0>:r
- Select a line object: (Select the reference line)
- Specify an angle: 20
- Enter rectangle width: 800
- Enter rectangle height: 350
Circle Enhancement
CONCENTRIC(C) option is new added in circle command, you can input radius several times to create many concentric circle after specify the circle center, with this new option, you can get concentric circle in a simple way.

Practice example:
To draw the concentric circle in Figure 1-6, the steps as below:
- Execute circle command and input concentric option or click the concentric icon in ribbon panel.
- Specify center point for circle:
- Specify the radius of circle or [Diameter] <400.0000>:100
- Specify the radius of circle or [Diameter/Undo] <100.0000>:200
- Specify the radius of circle or [Diameter/Undo] <200.0000>:300
Copy Enhancement
There are three options: measure(E), divide(I), path(P) options are added in copy command, user can easily finish the drawing without the assistance of other operations such as divided by segment, by distance, array, or layout bypath in previous version.

- measure(E)when users need to copy objects with same distance and same direction, this option will be very useful.

-
Divide(I), you can copy many objects with same distance in a specified distance.
-
Path(P)After select the path option, you can select divide or measure option again to locate the count objects.

Rotate Enhancement

Multiple copy (M) option is added in rotate command, with this option, you can either copy many objects with different rotate angles, or you can draw circles array. When rotate, you can select multiple copy option and input several angle values; the software will rotate and copy the object according to the value you input. You can try copy and rotate 45, 90,135 degree refers to the original object at a time such as the following figure.
Practice example: Rotate and copy objects in Figure1-7, the steps as below:
- Execute the Command: ROTATE
- Select object:
- Specify the base point: (Select the center of the concentric)
- Specify rotation angle or [Copy/Multiple/Reference] <135>: m
- Specify rotation angle or [Between/Fill]: 45
- Specify rotation angle or [Exit/Undo]: 90
- Specify rotation angle or [Exit/Undo]: 135

If the adjacent object angle is fixed, you can select “angle between object(B)or fill angle(F)option, then input the angle and the quantity, this option can replace circle array.
Rotate and copy objects in Figure1-8, the steps as below:
- Execute the command: ROTATE
- Select object: (Select the center of the concentric)
- Specify the base point:
- Specify rotation angle or [Copy/Multiple/Reference] <30>: m
- Specify rotation angle or [Between/Fill]: b
- Specify rotation angle: 60
- Specify total number of items: 4

Rotate and copy objects in Figure1-9, the steps as below:
- Execute the command: ROTATE
- Specify the base point: (Select the center of the concentric)
- Specify rotation angle or [Copy/Multiple/Reference] <60>: m
- Specify rotation angle or [Between/Fill]: f
- Specify angle to fill<360>:
- Specify total number of items: 1
Magnifier
MAGNIFIER (a real alternative to change the habit of viewing details and drafting over the most complex drawing at glance). This tool helps to view a specific area of your drawing as a magnifier with the capability of snap points without performing zoom in/out on big drawings like map or survey and also is practical to use and customize. Save time on exploring small details of your drawing or even drafting in a jungle of intersected objects easy and quickly.

1.- Before execute MAGNIFIER command, let’s explain its settings. At the status bar there is a magnifier icon, just right click mouse and select the option > settings…

2.-In the Drafting Settings dialog box, under Magnifier tab, we will see several options. Let’s explain one by one.

Enable Magnifier by Scroll button: If you check this option you can enable/disable the magnifier command by clicking the scroll wheel of the mouse. Also the shortcut key Ctrl+E is available to activate magnifier.
Magnifier Style
Region: When activating the magnifier, it will magnify the spot you select from your drawing within the magnifier shape. The cursor only can move in the magnifier shape. You can execute zoom, pan, and draw objects, etc to see the bigger and clearer details.
Window: When activating the magnifier, it will not only magnify the part you select, but also magnify the whole drawing according to the magnifier factor you set. With window style, the cursor can move in and out of the magnifier shape. The operations, for example zoom or draw objects will not be restricted in the shape of magnifier.
Magnifier Shape Square: If you choose square option, the magnifier will adopt a square shape. Circle: If you choose circle option, the magnifier will adopt a circle shape.
Magnifier Size: You can adjust the magnifier shape size as you like.
Fade Control: You can adjust the fade effect out of the magnifier shape.
Magnifier Factor: You can adjust the zoom factor within the magnifier shape.
QR Code

QR Code
A QR code (quick response code) is a type of bar code that is used to provide easy access to information through a mobile device like smart phone or tablet. Comparing with barcode, QR Code can storage more information and is widely applied in many fields, for example; product anti-fake, advertising push, web links, data download, commodity transaction, Positioning/navigation, electronic documents, business card exchange, etc. Take advantage of QR Code to make text and block attributes from your drawing scannable using any mobile phone or tablet with a camera. All you need is one of many available QR code reader applications for your device. Type QRCODE to execute the command. The command line mode -QRCODE also is supported, facilitating the creation of QR codes via scripts or programs.
Parameters of QR Code Creator as below:
Input:In input text area, you can input the text directly or you can pick text data from the drawing, also you can select the preset data which can display automatically in the input text box. Already entered:0/500:Displays the entered text number and the maximum Input text number. Clear:Cleans all data displayed at input text area. Pick Object: You can select three options to picking objects from your drawing. Text:Picks text from drawing file, the text will display in input text box automatically after you picked up. Block:Picks the attribute block from the drawing file, add the tag and value to the input text box. It is always used to pick the information of the tab. 2D Code: Picks the QR Code from the drawing file to get the information of QR Code Preset Data: You can preset data, when the data is needed just check the corresponding option. The information will automatically added to the input text area. Drawing Name: When check Drawing Name option, the drawing name will display in the input text area. Date and Time: When check Date and Time option, the current date and time will display in the input text area.

Parameters of Costumed Field as below:
Name>Add/Edit: You can customize field that common used, when the field is needed, click the pull down list to find it out and display it in input text box.
No: Input the field number. Name:Input the field name. Value: Input the field value. Add:Add new custom field. Delete: Delete custom field. Image: Company logo or others marked pictures can be added to QR Code. You can also browse pictures from your computer, JPG\BMP\PNG\TIF\TGA.etc formats are supported. Delete: Delete the picture selected.

QR Code Parameters: You can set QR Code image parameters before being inserted. Version:Creates QR Code according to the data you input. Sets the QR Code version, the version number will adaptively according to the increase of text. Error Level:Error level for QR Code data generated. Size:Set the width of QR Code. H (30%)\Q(25%)\M (15%)\L (7%): the compatibility of correcting about 15% data error. Code:QR Code system. Currently we support Code93. Scale:Set the QR Code printing scale, behind the scale option is the scale list. You can choose the scale needed, meanwhile, the scale list can remind user the QR Code generating is related to the printing scale. Finally, it will generate as a block, the scale you set can be the block scale to ensure the QR Code can be printed correctly in different printing scales.

Copy Barcode: Copies an existing QR Code from your current drawing. Save Image: Saves the QR Code as a picture, you can either use the picture to print or insert to other document or to CAD drawing. Insert: Inserts the generated QR Code to the drawing as a block Cancel: Cancel the dialog box and save the current settings, when you open the dialog box next time, the setting you saved last time will be displayed.
Barcode
Barcode technology has been widely used in a variety of industries. In some design companies, barcode has also been used in drawing management system, mainly used to corresponding paper documents and electronic drawing file, just by scanning the bar code in the paper drawing to identify quickly the corresponding part in electronic drawing file.

Parameters of Bar Code Creator as below:
Width: Set the bar code printing width. Height: Set the bar code printing height. Scale: Set the barcode printing scale, behind the scale option is the scale list, you can choose the scale needed, meanwhile, the scale list can remind user the bar code generating is relate to the printing scale. Finally, barcode will generate as a block, the scale you set can be the block scale to ensure barcode can be printed correctly in different printing scales. Display Data: Control whether display the data under the bar code. Size: If “Display data” option is checked means option is activated, you can set the data height. Code:Bar code system. Currently we support Code93. Preview: Displays the bar code image and the data input. Data input box:You can directly input bar code data, also can click seed to generate barcode. Seed: Generate barcode data by random algorithm. Click the "seed" button, the barcode data will generate randomly and display directly to the data input box above. Length: Set the length of the bar code data. There are two ways: one is control the data length which manually input and random generated. The other is control the data length that random generated, check the "seed" before activate this setting. Pick: Pick up text or bar code. If you pick the data, it will only obtain the data displayed, but if you pick the barcode, you will get the information of barcode width, height and proportion and data Save Image: Save the barcode to BMP format picture, you can either use the picture to print or insert to other document or to CAD drawing. Insert: Define the barcode generated as a block and take left bottom of the barcode as base point. You can insert the barcode to the drawing file through the insertion point with the scale set before. Cancel: Cancel the dialog box and save the current settings, when you open the dialog box next time, the setting you saved last time will display.
Symmetric Draw
No matter it is AEC or MFG industry, there are many symmetric drawing shapes. The usual way to make a symmetric shape is to draw the first half of the shape and then get another symmetric half by copy or mirror.

It is possible to directly draw symmetrical shapes with Symmetric Draw tool. When drawing the first half you get another half automatically. The default symmetry axis is X-axis, but user can specify Y-axis or any line in the drawing as symmetry axis reference.

Users can easily switch on/off this tool by clicking the Symmetric Draw button on the status bar. By the way, Symmetric Draw tool supports all the drawing commands of GstarCAD.

Exploring Symmetric Draw Properties
Right-Click the Symmetric Draw button at status bar and select Settings option. The Drafting Settings dialog box will pop up. Now let’s explore the properties under Symmetric Drawing tab.

Enable Symmetric Draw: Enables the symmetric draw tool if is checked.
Pick Symmetric Axis: You can pick X, Y, or a custom axis to start working with.
Supported Objects: Symmetric draw tool supports line, circle, rectangle, polygon, ray, polyline, ellipse, arc, xline and spline objects to be drawn as symmetrical shape.
Select All/ Erase All: You can select or unselect all supported objects at once.


Symmetric Axis Effect
X Axis option: The objects drawn will take the X coordinate system as invisible axis line. The effect of X Axis is mirroring the drawn objects up or down according to X coordinate system origin location.

Y Axis option: The objects drawn will take the Y coordinate system as invisible axis line. The effect of Y Axis is mirroring the drawn objects right or left side according to Y coordinate system origin location.

Custom/Pick Axis option: The objects drawn will take the vector orientation of a selected object as visible axis line. The effect of Custom/Pick Axis is mirroring the drawn objects according to a selected object vector orientation whether inclined, vertical or horizontal.

Pick Symmetric Axis: At status bar, besides Symmetric Draw button is located another button called Pick Symmetric Axis. The functionality of this button is as same as Custom and Pick Axis options.
Outline Objects


Outline Objects
OUTLINE command is another innovative tool of GstarCAD. This tool allows extract the outline shape of selected closed objects in a window selection method. This outlined shape is in fact a polyline object created on the current layer that you are working with.
For example, use this tool extract the outline shape of a floor plant house to later calculate its total area or to reference draw the roof of it.
Remark: Other innovative features, such as Break Object, Block Break, Graphic Compare, Pline Boolean, Align tool, Arrange Tool, AutoXLSTable, CAD Table to Excel, Text Incremental Copy, Statistics Summation, Text on line, GstarCAD Tools, Drawing Compare, Drawing Lock, Batch Purge, etc. Please refer to the express tool guide.
Area Table

Area Table
The enclosed area and object can be marked number or area, and the area table can be generated at the same time. The area data can be exported to a text or table file. The values in the table can be changed automatically when the number or area size is changed.
Steps to use Area Table
-
Click “Express Tools”>“Area Table” in turn.
-
Popup "Area Table" dialog box.
-
Click “Pick Point” or “Select Obj” to mark area.
-
If the you checked "Generate Table", you need to determine the table location or the table to be added.
-
Click the available point coordinate to go directly to the next process. Or select the available existing area table to enter the next process.
-
After the table is created or selected, the area can be updated automatically by “Pick Point” or “Select Obj”.
Automatically Layer

Automatically Layer
Predefines the association between object type and the layer that should be drawn in a drawing. System automatically switches the current layer while drawing the graph, and draws the graphic to the set layer. If the specified layer does not exist, the system will automatically create this layer based on the settings.
About Automatically layer dialog box
Autolayer list:
Display the command name and the corresponding automatic layer settings.
Create a layer setting:
Create a new layer settings including the command name and the corresponding layer settings.
Delete layer setting:
Delete one or more selected automatic layer settings.
Enable Autolayer:
After checking this check box, the software can automatically assign the layer based on the settings when drawing, if not checked, it doesn’t work.
Save Settings:
Save your current settings to a text file.
Load Settings:
Read the settings file saved by the user and read the settings into the dialog box.
Clear Settings:
Clear all current auto layer settings.
Remark: the current settings only work for the currently edited drawing.
Attribute Increment

Attribute Increment can sort and increment the attribute value of the attribute block of the same name according to the way you set. The property value of the attribute block is modified based on the sort value. For example, the attribute value of the axis number is incremented by the way it is set.
About Attribute Increment dialog box
Auto Increa
All referenced properties of the selected block are automatically incremented, which is copied, inserted, deleted in the graph, and the attribute number is automatically updated. When "ATTINC" is on, as long as the drawing is not closed, when copying, inserting and deleting the block in the drawing, the property number can be updated automatically.
Increase the select:
Only the selected block is processed, and the selected block property is incremented by the order of creation.
Select a block:
Click “Select the block” button, and you can pick up a block from the graphics and acquire the name of the block. If there is no attribute in the block you picked up, then prompt: The selected block has no attributes. And you need to pick up again.
Block:
Select a block in block list. If there is no attribute in the block you picked up, then prompt: The selected block has no attributes. And you need to select again.
Select the attribute to increase:
Select the tags to increase. If the block only has one attribute, then the only attribute will be selected automatically. But if the block has more than one attribute, then all the attributes will be displayed and you can select one or more attributes to increase.
Parameter:
Increment:
The attribute value of the selected block is increased by the increment value.
Add ration:
Add the same increment value to the increment number or letter of the attribute value in attribute block.
Increment Mode:
Here are 3 increment modes: Increase every number, Increase the last number and Increase the first number.
Default option is Increase the last number. If there are numbers in the end, these numbers increase as a whole. If you select Increase the first number, and here are numbers in the first, they also increase as a whole. If you select Increase every number, each number in the attribute value is incremented.
Increment Number:
The default number is “1”, and you can modify it if needed.
Sort:
Set the sort of increment as the followings: Draw Order, Select Order, Left to Right, Up to Down and The Path of Curve. The default sort is Draw Order, you can select other sorts.
If you select The Path of Curve, system will prompt you to select a curve. the curve can be a curve or a polyline which intersects with the selected block, and sort according to the order of the point which is closest to the insertion point of each attribute block on the curve. If all the points are as the same point, then according to the distance between each insertion point of attribute block and the curve to sort.
Negative Sequence:
Reverse the order above.

Viewport from Model
Creates a viewport on layout space by selecting objects in the model space. And then calculate the viewport size according to the set ratio and locate the viewport in the layout space. You can quickly create and set a viewport of the graphics.
Steps to use Viewport from Model
-
In 2D Drafting space. Click “View”>“Layout Viewport” in turn.
-
Specify the first corner point and the diagonal point.
Extents: Obtain the value of the system variables of EXTMIN and EXTMAX in the model space. When EXTMIN and EXTMAX are the same or wrong, the "Extents" option is not displayed. Display: Plot the scope displayed in the Model space currently.
Limits: Obtain the value of the system variables of LIMMIN and LIMMAX in the model space.
When an error scope is obtained, the viewport is not created and shows that "The scope for creating the viewport failed."
- Please select the layout to create
After you select the scope, the system will prompts you to select the layout to create.
-If the command is executed in the Layout space, the viewport is created directly in the layout space of the command.
-If the command is executed in the Model space, the dialog box pops up for you to select the layout.
- Specify the insertion point to viewport
-After setting the layout, automatically switch to the selected layout and specify the insertion point of the viewport.
-You can enter coordinates or click a point to set the location of the viewport in a graphical window.
-After setting the location, the computed viewport is generated at the specified location, and the display locked of the viewport is on.
Free Scale
FREESCALE command allows you to scales an object or a group of objects without restrictions under three methods; Non-Uniform, Rectangle and Free.
Non-uniform scale: The scale of X and Y axis can be input separately.
Rect Scale: You can scale a graphic to match a rectangle frame. The rectangle does not need to be drawn, just specify two diagonal points.
Free Scale: You can move or copy and scale the graphics in a closed quadrilateral frame to another closed quadrilateral frame, which can be used to generate the pattern of tilting or perspective distortion graphics.
Learn more innovative Features from: https://www.gstarcad.net/help/GstarCAD_2025_en-US.html
Collaboration
GstarCAD 365 is a powerful multi-platform tool designed to enhance team efficiency in viewing drawings, managing projects, communicating, and collaborative design. Businesses can choose between Public Cloud or Private Cloud deployment based on specific needs.


PDF page 12 — additional source text
Chapter1_GstaCAD 2025 Introduction and Installation
PDF page 13 — additional source text
Chapter1_GstaCAD 2025 Introduction and Installation
PDF page 13 — additional source text
Users can visit www.gstarcad.net to download GstarCAD 2025 to your computer or server.
PDF page 14 — additional source text
Chapter1_GstaCAD 2025 Introduction and Installation
PDF page 15 — additional source text
Chapter1_GstaCAD 2025 Introduction and Installation
PDF page 16 — additional source text
Chapter1_GstaCAD 2025 Introduction and Installation
PDF page 17 — additional source text
Chapter1_GstaCAD 2025 Introduction and Installation
PDF page 18 — additional source text
Chapter2_Starting Up GstarCAD 2025
PDF page 19 — additional source text
Chapter2_Starting Up GstarCAD 2025
PDF page 20 — additional source text
Chapter2_Starting Up GstarCAD 2025
PDF page 21 — additional source text
Chapter2_Starting Up GstarCAD 2025
PDF page 22 — additional source text
Chapter2_Starting Up GstarCAD 2025
PDF page 23 — additional source text
Chapter2_Starting Up GstarCAD 2025
PDF page 24 — additional source text
Chapter2_Starting Up GstarCAD 2025
PDF page 25 — additional source text
Chapter2_Starting Up GstarCAD 2025
PDF page 26 — additional source text
Chapter2_Starting Up GstarCAD 2025
PDF page 27 — additional source text
Chapter2_Starting Up GstarCAD 2025
PDF page 28 — additional source text
Chapter2_Starting Up GstarCAD 2025

PDF page 29 — additional source text
Chapter2_Starting Up GstarCAD 2025

PDF page 30 — additional source text
Chapter2_Starting Up GstarCAD 2025
PDF page 31 — additional source text
Chapter2_Starting Up GstarCAD 2025

PDF page 32 — additional source text
Chapter2_Starting Up GstarCAD 2025

PDF page 33 — additional source text
Chapter2_Starting Up GstarCAD 2025
PDF page 34 — additional source text
Chapter2_Starting Up GstarCAD 2025
PDF page 35 — additional source text
Chapter2_Starting Up GstarCAD 2025
PDF page 36 — additional source text
Chapter2_Starting Up GstarCAD 2025
PDF page 37 — additional source text
Chapter2_Starting Up GstarCAD 2025
PDF page 38 — additional source text
Chapter2_Starting Up GstarCAD 2025
PDF page 39 — additional source text
Chapter 2_Starting up GstarCAD 2025
PDF page 40 — additional source text
Chapter 2_Starting up GstarCAD 2025

PDF page 41 — additional source text
Chapter 2_Starting up GstarCAD 2025
PDF page 42 — additional source text
Chapter 2_Starting up GstarCAD 2025
PDF page 43 — additional source text
Chapter 2_Starting up GstarCAD 2025
PDF page 44 — additional source text
Chapter 2_Starting up GstarCAD 2025

PDF page 45 — additional source text
Chapter 2_Starting up GstarCAD 2025
PDF page 46 — additional source text
Chapter 2_Starting up GstarCAD 2025
PDF page 47 — additional source text
Chapter 2_Starting up GstarCAD 2025
PDF page 48 — additional source text
Chapter3_Create, Open, Save, Recover a Drawing and Manage Drawings
PDF page 49 — additional source text
Chapter3_Create, Open, Save, Recover a Drawing and Manage Drawings
PDF page 50 — additional source text
Chapter3_Create, Open, Save, Recover a Drawing and Manage Drawings
PDF page 51 — additional source text
Chapter3_Create, Open, Save, Recover a Drawing and Manage Drawings
PDF page 52 — additional source text
Chapter3_Create, Open, Save, Recover a Drawing and Manage Drawings
PDF page 53 — additional source text
Chapter3_Create, Open, Save, Recover a Drawing and Manage Drawings
PDF page 54 — additional source text
Chapter3_Create, Open, Save, Recover a Drawing and Manage Drawings
PDF page 55 — additional source text
Chapter3_Create, Open, Save, Recover a Drawing and Manage Drawings
PDF page 56 — additional source text
Chapter3_Create, Open, Save, Recover a Drawing and Manage Drawings
PDF page 57 — additional source text
Chapter3_Create, Open, Save, Recover a Drawing and Manage Drawings
PDF page 58 — additional source text
Chapter3_Create, Open, Save, Recover a Drawing and Manage Drawings
PDF page 59 — additional source text
Chapter3_Create, Open, Save, Recover a Drawing and Manage Drawings
PDF page 60 — additional source text
Chapter3_Create, Open, Save, Recover a Drawing and Manage Drawings
PDF page 61 — additional source text
Chapter3_Create, Open, Save, Recover a Drawing and Manage Drawings
PDF page 62 — additional source text
Chapter 4_Control the Drawing Views
PDF page 63 — additional source text
Chapter 4_Control the Drawing Views
PDF page 64 — additional source text
Chapter 4_Control the Drawing Views
PDF page 65 — additional source text
Chapter 4_Control the Drawing Views
PDF page 66 — additional source text
Chapter 4_Control the Drawing Views
PDF page 67 — additional source text
Chapter 4_Control the Drawing Views
PDF page 68 — additional source text
Chapter 4_Control the Drawing Views
PDF page 69 — additional source text
Chapter 4_Control the Drawing Views
PDF page 70 — additional source text
Chapter 4_Control the Drawing Views
PDF page 71 — additional source text
Chapter 4_Control the Drawing Views
PDF page 72 — additional source text
Chapter 4_Control the Drawing Views
PDF page 73 — additional source text
Chapter 4_Control the Drawing Views
PDF page 74 — additional source text
Chapter 4_Control the Drawing Views
PDF page 75 — additional source text
Chapter 4_Control the Drawing Views
PDF page 76 — additional source text
Chapter 5_Precision Tools and the Properties of Drawings

PDF page 77 — additional source text
Chapter 5_Precision Tools and the Properties of Drawings
PDF page 78 — additional source text
Chapter 5_Precision Tools and the Properties of Drawings
PDF page 79 — additional source text
Chapter 5_ Precision Tools and the properties of Drawing
PDF page 80 — additional source text
Chapter 5_ Precision Tools and the properties of Drawing
PDF page 81 — additional source text
Chapter 5_ Precision Tools and the properties of Drawing
PDF page 82 — additional source text
Chapter 5_ Precision Tools and the properties of Drawing
PDF page 83 — additional source text
Chapter 5_ Precision Tools and the properties of Drawing
PDF page 84 — additional source text
Chapter 5_ Precision Tools and the properties of Drawing
PDF page 85 — additional source text
Chapter 5_ Precision Tools and the properties of Drawing
PDF page 86 — additional source text
Chapter 5_ Precision Tools and the properties of Drawing
PDF page 87 — additional source text
Chapter 5_ Precision Tools and the properties of Drawing
PDF page 88 — additional source text
Chapter 5_ Precision Tools and the properties of Drawing
PDF page 89 — additional source text
Chapter 5_ Precision Tools and the properties of Drawing
PDF page 90 — additional source text
Chapter 5_ Precision Tools and the properties of Drawing
PDF page 91 — additional source text
Chapter 5_ Precision Tools and the properties of Drawing
PDF page 92 — additional source text
Chapter 5_ Precision Tools and the properties of Drawing
PDF page 93 — additional source text
Chapter 5_ Precision Tools and the properties of Drawing

PDF page 95 — additional source text
Chapter 5_ Precision Tools and the properties of Drawing

PDF page 96 — additional source text
Chapter 6_ Create Objects
PDF page 97 — additional source text
Chapter 6_ Create Objects
PDF page 98 — additional source text
Chapter 6_ Create Objects
PDF page 99 — additional source text
Chapter 6_ Create Objects
PDF page 100 — additional source text
Chapter 6_ Create Objects
PDF page 101 — additional source text
Chapter 6_ Create Objects
PDF page 102 — additional source text
Chapter 6_ Create Objects
PDF page 103 — additional source text
Chapter 6_ Create Objects
PDF page 104 — additional source text
Chapter 6_ Create Objects
PDF page 105 — additional source text
Chapter 6_ Create Objects
PDF page 106 — additional source text
Chapter 6_ Create Objects
PDF page 107 — additional source text
Chapter 6_ Create Objects
PDF page 108 — additional source text
Chapter 6_ Create Objects
PDF page 109 — additional source text
Chapter 6_ Create Objects
PDF page 110 — additional source text
Chapter 6_ Create Objects
PDF page 111 — additional source text
Chapter 6_ Create Objects
PDF page 112 — additional source text
Chapter 6_ Create Objects
PDF page 113 — additional source text
Chapter 6_ Create Objects
PDF page 114 — additional source text
Chapter 6_ Create Objects
PDF page 115 — additional source text
Chapter 6_ Create Objects
PDF page 116 — additional source text
Chapter 6_ Create Objects
PDF page 117 — additional source text
Chapter 6_ Create Objects
PDF page 118 — additional source text
Chapter 6_ Create Objects
PDF page 119 — additional source text
Chapter 6_ Create Objects
PDF page 120 — additional source text
Chapter 6_ Create Objects
PDF page 121 — additional source text
Chapter 6_ Create Objects
PDF page 122 — additional source text
Chapter 6_ Create Objects
PDF page 123 — additional source text
Chapter 6_ Create Objects
PDF page 124 — additional source text
Chapter 6_ Create Objects
PDF page 125 — additional source text
Chapter 6_ Create Objects
PDF page 126 — additional source text
Chapter7_ Modify Objects
PDF page 127 — additional source text
Chapter7_ Modify Objects
PDF page 128 — additional source text
Chapter7_ Modify Objects
PDF page 129 — additional source text
Chapter7_ Modify Objects
PDF page 130 — additional source text
Chapter7_ Modify Objects
PDF page 131 — additional source text
Chapter7_ Modify Objects
PDF page 132 — additional source text
Chapter7_ Modify Objects
PDF page 133 — additional source text
Chapter7_ Modify Objects
PDF page 134 — additional source text
Chapter7_ Modify Objects
PDF page 135 — additional source text
Chapter7_ Modify Objects
PDF page 136 — additional source text
Chapter7_ Modify Objects
PDF page 137 — additional source text
Chapter7_ Modify Objects
PDF page 138 — additional source text
Chapter7_ Modify Objects
PDF page 139 — additional source text
Chapter 8_ Notes and Labels
PDF page 140 — additional source text
Chapter 8_ Notes and Labels
PDF page 141 — additional source text
Chapter 8_ Notes and Labels
PDF page 142 — additional source text
Chapter 8_ Notes and Labels
PDF page 143 — additional source text
Chapter 8_ Notes and Labels
PDF page 144 — additional source text
Chapter 9_ Dimensions and Tolerances
PDF page 145 — additional source text
Chapter 9_ Dimensions and Tolerances
PDF page 146 — additional source text
Chapter 9_ Dimensions and Tolerances
PDF page 147 — additional source text
Chapter 9_ Dimensions and Tolerances
PDF page 148 — additional source text
Chapter 9_ Dimensions and Tolerances
PDF page 149 — additional source text
Chapter 9_ Dimensions and Tolerances
PDF page 150 — additional source text
Chapter 9_ Dimensions and Tolerances
PDF page 151 — additional source text
Chapter 9_ Dimensions and Tolerances
PDF page 152 — additional source text
Chapter 9_ Dimensions and Tolerances
PDF page 153 — additional source text
Chapter 9_ Dimensions and Tolerances
PDF page 154 — additional source text
Chapter 9_ Dimensions and Tolerances
PDF page 155 — additional source text
Chapter 9_ Dimensions and Tolerances
PDF page 156 — additional source text
Chapter 9_ Dimensions and Tolerances
PDF page 157 — additional source text
Chapter 9_ Dimensions and Tolerances
PDF page 158 — additional source text
Chapter 9_ Dimensions and Tolerances
PDF page 159 — additional source text
Chapter 9_ Dimensions and Tolerances
PDF page 160 — additional source text
Chapter 9_ Dimensions and Tolerances
PDF page 161 — additional source text
Chapter 10_ Blocks, Attribute and Xrefs
PDF page 162 — additional source text
Chapter 10_ Blocks, Attribute and Xrefs
PDF page 163 — additional source text
Chapter 10_ Blocks, Attribute and Xrefs
PDF page 164 — additional source text
Chapter 10_ Blocks, Attribute and Xrefs
PDF page 165 — additional source text
Chapter 10_ Blocks, Attribute and Xrefs
PDF page 166 — additional source text
Chapter 10_ Blocks, Attribute and Xrefs
PDF page 167 — additional source text
Chapter 10_ Blocks, Attribute and Xrefs
PDF page 168 — additional source text
Chapter 10_ Blocks, Attribute and Xrefs
PDF page 169 — additional source text
Chapter 10_ Blocks, Attribute and Xrefs
PDF page 170 — additional source text
Chapter 10_ Blocks, Attribute and Xrefs
PDF page 171 — additional source text
Chapter 10_ Blocks, Attribute and Xrefs
PDF page 172 — additional source text
Chapter 11_ Hatches and Raster Images
PDF page 173 — additional source text
Chapter 11_ Hatches and Raster Images
PDF page 174 — additional source text
Chapter 11_ Hatches and Raster Images
PDF page 175 — additional source text
Chapter 11_ Hatches and Raster Images
PDF page 176 — additional source text
Chapter 11_ Hatches and Raster Images
PDF page 177 — additional source text
Chapter 11_ Hatches and Raster Images
PDF page 178 — additional source text
Chapter 12_ Layout, Plot and Publish Drawing
PDF page 179 — additional source text
Chapter 12_ Layout, Plot and Publish Drawing
PDF page 180 — additional source text
Chapter 12_ Layout, Plot and Publish Drawing
PDF page 181 — additional source text
Chapter 12_ Layout, Plot and Publish Drawing
PDF page 182 — additional source text
Chapter 12_ Layout, Plot and Publish Drawing
PDF page 183 — additional source text
Chapter 12_ Layout, Plot and Publish Drawing
PDF page 184 — additional source text
Chapter 12_ Layout, Plot and Publish Drawing
PDF page 185 — additional source text
Chapter 12_ Layout, Plot and Publish Drawing
PDF page 186 — additional source text
Chapter 12_ Layout, Plot and Publish Drawing
PDF page 187 — additional source text
Chapter 12_ Layout, Plot and Publish Drawing
PDF page 188 — additional source text
Chapter 12_ Layout, Plot and Publish Drawing
PDF page 189 — additional source text
Chapter 13_ Create and Edit Dynamic Blocks

PDF page 190 — additional source text
Chapter 13_ Create and Edit Dynamic Blocks
PDF page 191 — additional source text
Chapter 13_ Create and Edit Dynamic Blocks
PDF page 192 — additional source text
Chapter 13_ Create and Edit Dynamic Blocks
PDF page 193 — additional source text
Chapter 13_ Create and Edit Dynamic Blocks
PDF page 194 — additional source text
Chapter 13_ Create and Edit Dynamic Blocks
PDF page 195 — additional source text
Chapter 13_ Create and Edit Dynamic Blocks

PDF page 196 — additional source text
Chapter 13_ Create and Edit Dynamic Blocks

PDF page 197 — additional source text
Chapter 13_ Create and Edit Dynamic Blocks

PDF page 198 — additional source text
Chapter 13_ Create and Edit Dynamic Blocks

PDF page 199 — additional source text
Chapter 13_ Create and Edit Dynamic Blocks

PDF page 200 — additional source text
Chapter 13_ Create and Edit Dynamic Blocks

PDF page 201 — additional source text
Chapter 13_ Create and Edit Dynamic Blocks

PDF page 202 — additional source text
Chapter 13_ Create and Edit Dynamic Blocks

PDF page 203 — additional source text
Chapter 13_ Create and Edit Dynamic Blocks

PDF page 204 — additional source text
Chapter 13_ Create and Edit Dynamic Blocks

PDF page 205 — additional source text
Chapter 13_ Create and Edit Dynamic Blocks

PDF page 206 — additional source text
Chapter 13_ Create and Edit Dynamic Blocks

PDF page 207 — additional source text
Chapter 13_ Create and Edit Dynamic Blocks

PDF page 208 — additional source text
Chapter 13_ Create and Edit Dynamic Blocks

PDF page 209 — additional source text
Chapter 13_ Create and Edit Dynamic Blocks

PDF page 210 — additional source text
Chapter 14_ Parametric Constraints

PDF page 211 — additional source text
Chapter 14_ Parametric Constraints

PDF page 212 — additional source text
Chapter 14_ Parametric Constraints

PDF page 213 — additional source text
Chapter 14_ Parametric Constraints

PDF page 214 — additional source text
Chapter 14_ Parametric Constraints

PDF page 215 — additional source text
Chapter 14_ Parametric Constraints

PDF page 216 — additional source text
Chapter 14_ Parametric Constraints

PDF page 217 — additional source text
Chapter 14_ Parametric Constraints
PDF page 218 — additional source text
Chapter 14_ Parametric Constraints
PDF page 219 — additional source text
Chapter 15_ Share Data between Applications

PDF page 220 — additional source text
Chapter 15_ Share Data between Applications
PDF page 221 — additional source text
Chapter 15_ Share Data between Applications
PDF page 222 — additional source text
Chapter 15_ Share Data between Applications
PDF page 223 — additional source text
Chapter 15_ Share Data between Applications
PDF page 224 — additional source text
Chapter 15_ Share Data between Applications
PDF page 225 — additional source text
Chapter 15_ Share Data between Applications
PDF page 226 — additional source text
Chapter 15_ Share Data between Applications
PDF page 227 — additional source text
Chapter 16_ Security
PDF page 228 — additional source text
Chapter 16_ Security

PDF page 229 — additional source text
Chapter 16_ Security

PDF page 230 — additional source text
Chapter 16_ Security
PDF page 231 — additional source text
Chapter 16_ Security

PDF page 232 — additional source text
Chapter 16_ Security
PDF page 233 — additional source text
Chapter 16_ Security
PDF page 234 — additional source text
Chapter 17_ BIM Support

PDF page 235 — additional source text
Chapter 17_ BIM Support
PDF page 235 — additional source text
o Select an existing rule, then click the Add or right-click and
PDF page 236 — additional source text
Chapter 17_ BIM Support
PDF page 237 — additional source text
Chapter 17_ BIM Support

PDF page 238 — additional source text
Chapter 17_ BIM Support

PDF page 239 — additional source text
Chapter 18_ Innovative Features
PDF page 240 — additional source text
Chapter 18_ Innovative Features
PDF page 241 — additional source text
Chapter 18_ Innovative Features
PDF page 242 — additional source text
Chapter 18_ Innovative Features
PDF page 243 — additional source text
Chapter 18_ Innovative Features
PDF page 244 — additional source text
Chapter 18_ Innovative Features
PDF page 245 — additional source text
Chapter 18_ Innovative Features
PDF page 246 — additional source text
Chapter 18_ Innovative Features
PDF page 247 — additional source text
Chapter 18_ Innovative Features
PDF page 248 — additional source text
Chapter 18_ Innovative Features
PDF page 249 — additional source text
Chapter 18_ Innovative Features
PDF page 250 — additional source text
Chapter 18_ Innovative Features
PDF page 251 — additional source text
Chapter 18_ Innovative Features
PDF page 252 — additional source text
Chapter 18_ Innovative Features
PDF page 253 — additional source text
Chapter18_ Collaboration