PLOT command
The PLOT command is used to export drawings to plotter or printer or files.
Command Access:
Ribbon : Export > Plot > Plot
Menu : Application menu > Print... > Print...
Menu : File > Plot...
Command : PLOT
Function Description:
Inputting "-plot" under command line, it will display options.
Relative Glossary:
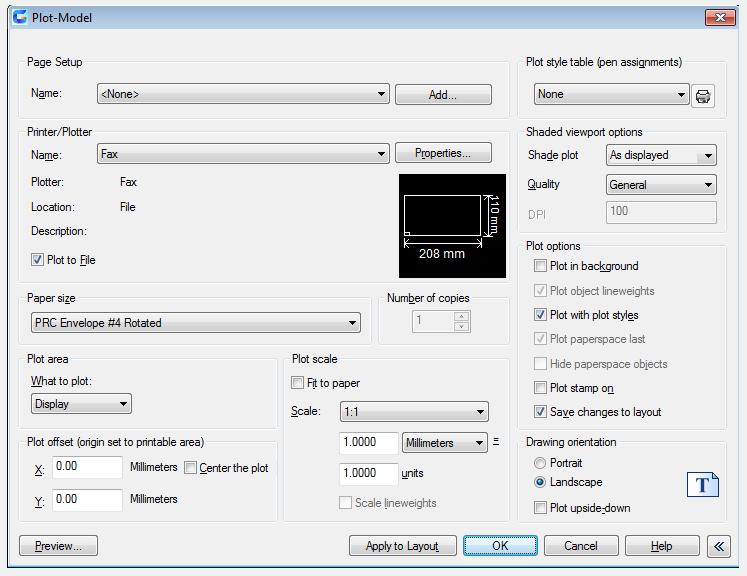
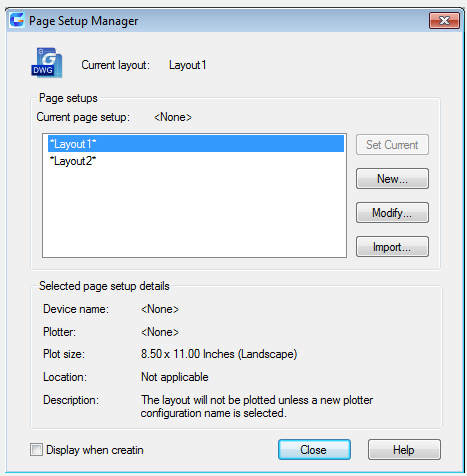
Page setup
List the named or saved page setup in the drawing. The saved named setup could be set to be current. Users could also click "Add" button to create a new setup.
Name : Display the name of current page setup.
Add : Display the "Add Page Setup" dialog box, from which users could save the current page set up to a named page setup.
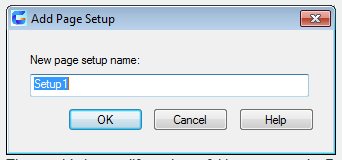
They could also modify settings of this page setup by Page Setup Manager.
Printer/plotter
Use the configured printer/plotter when specifying a layout to print.
If the selected plotter does not support the specified drawing size in layout, it displays warning. Users could select the default plotter drawing size or customized size.
Name : List all available PC3 files or system printers. Users could select one file to plot the current layout.
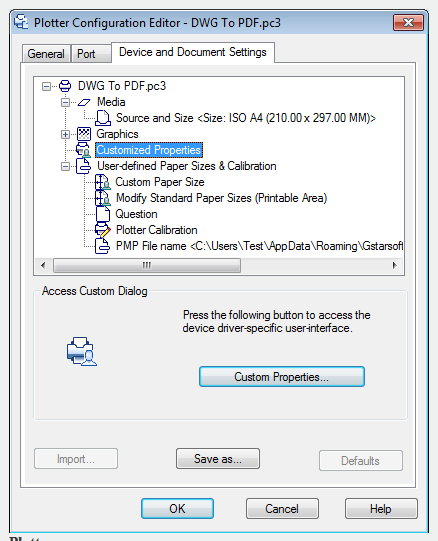
Properties : Display the Plotter Configuration Editor, from which users could view or edit the current plotter settings of configurations, ports, equipment and medias.
Plotter : Display specified plotter for selected page setup.
Location : Display the physical location of the specified output equipment in current selected page setup.
Description : Display the description of the specified output equipment in current selected page setup. Users could edit the description in Plotter Configuration Editor.
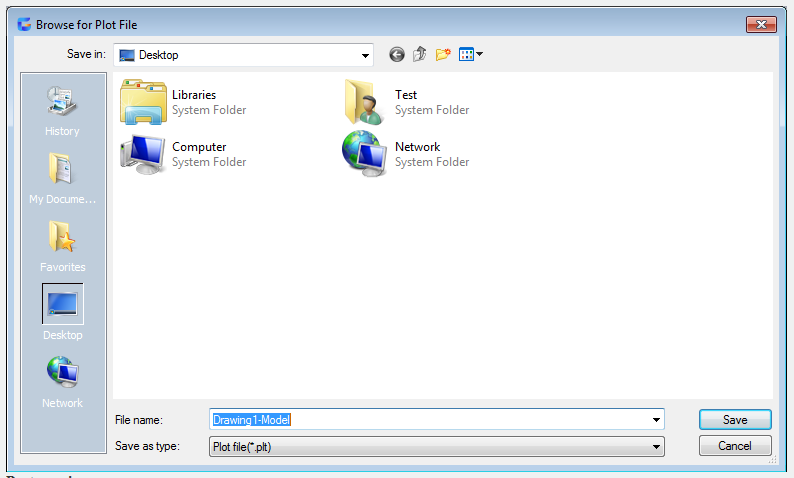
Plot to File : Plot to file rather than to plotter or printer. Checking the "Plot to File" option, it display the "Browse for Plot File" dialog box after pressing "OK".
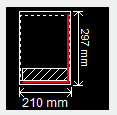
Part preview : It accurately displays the relative paper size and the valid print region for printable region.
Paper size
Display the available standard paper size for selected printer. If users has not selected plotter, it displays all standard paper size list.
When selecting the "Add plotter…" option to create a PC3 file, it will set default paper size for specified plotter. The paper size selected from Page setup dialog box will be saved together with layout and replace the PC3 file.
The actual printable region in layout is determined by dashed line.
If printing a raster image( such as BMP or TIFF file), the size of print region means measure it by pixels rather than inches or millimeters.
Number of copies
Specify the number of copies for printing. If checked the "Plot to File" option, this option will not be available.
Plot area
Specify the region to plot. Users could select the plot region in the "Plot area" option.
Limits
When plotting layouts, it will plot all content in specified plot area for selected paper size. The origin is calculated from (0.0) in the layout. When plotting from model space, define the grid limit as the plot region. If the current viewport could not display flat view, this option has the same effect of the "Extend" option.
Extends
Plot part of current space which contains objects. All geometric figures in current space will be plotted. It may regenerate the drawing to recalculate region.
Display
Plot the current view in selected model space or the current paper space view in selected layout.
View
Plot the saved view which is saved by VIEW command. Users could select the named view from list. If there is no saved view in drawing, this option is unavailable. After selecting "View" option, it display view list and displays all saved named views. Users could select a view to plot from this list.
Window
Plot specified drawing. If selected the "Window" option, this button becomes available button. Clicking "Window" button to specify the plot region by two corner points with point device, or input the coordinates of two points.
Plot offset
The "Plot Offset" option is used to specify the plot offset.
The printable area is determined by selected output equipment and displays by dashed lines. The printable area may change when changing the output equipment. Inputting a positive value or a negative value in the "X" or "Y" input box, the geometric figure will offset in the drawing. The unit of plotter is inch or millimeter.
Center the plot : Calculate the X offset value and Y offset value automatically. When setting the print region to be "layout", this option is unavailable.
X : Specify the print origin in X direction according to settings of "Plot offset".
Y : Specify the print origin in Y direction according to settings of "Plot offset".
Plot scale
Control the relative size of drawing unit and plot unit. When plotting a layout, the default plot scale is 1:1. When plotting from model space, the default setting is "Fit to paper".
Fit to paper
Scale the drawing to fit to paper. It displays the customized scale factors in "Scale", "pixel=" and "unit" box.
Scale
Define the accurate scale for plotting. The "User define" option could customize the scales. Users could create a customized scale by inputting an inches (or millimeters) value which is equivalent to drawing unit. Note: users could use the SCALELISTEDIT command to modify the scale list.
Inches/Millimeters
Specify the unit to be inches or millimeters in plot dialog box. By default, it is determined by the current drawing size, and it could be modified when selecting new paper size each time. The "Pixel" option only cold be available when selected raster output.
Units
Specify the unit which is equivalent to specified inches, millimeters or pixels.
Scale lineweight
The lineweigh is direct proportion to plot scale. The lineweight is usually means the width of line in the plot object and the object will be plotted according to this line width, without regard to plot scale.
Preview
Display the drawing according to the way starting up the PREVIEW command to plot. Pressing ESC to exit preview and return to plot dialog box.
Apply to layout
Save the settings of current plot dialog box to current layout.
Other options
Control whether to display other options in plot dialog box.
Plot style table (pen assignments)
Set, edit the plot style table or create new plot style tables.
Name
Display the plot style table which has specified to model space or layout. Supply available plot style table list.
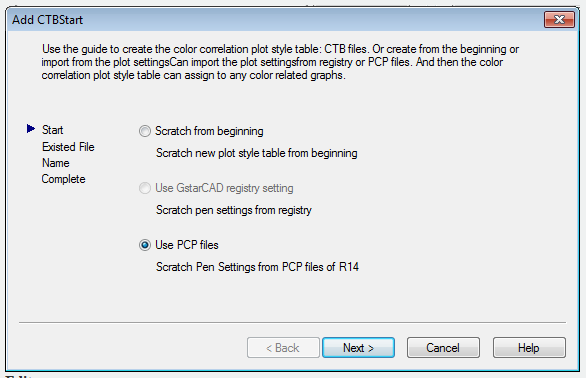
Selecting "New" to display the "Add CTB Start". Users could use it to create new plot style tables. The wizard is determined by selected drawing, in color relation plot style or named style.
Edit : Display the "Plot Style Editor", from which users could view or modify the currently specified plot style in plot style table.
Shaded viewport options
Specify the color and render style and determine their pixels and DPI.
Shade plot
Specify ways for plotting view. To set this option to viewport in layout, please select this viewport first and then click "Properties" in "Tools" menu.
In model space, it displays the following options:
As displayed
Plot objects as displayed in the screen.
Wireframe
Plot objects in wireframe style by traditional SHADEMODE command without regard to other display styles in the screen.
Hidden
Plot objects and clear hide lines by traditional SHADEMODE command without regard to other display styles in the screen.
3D hidden
Plot objects and clear hide lines without regard to other display styles in the screen.
2dwireframe
Plot objects in wireframe style without regard to other display styles in the screen.
Conceptual
Plot objects by conceptual visual style without regard to other display styles in the screen.
Realistic
Plot objects by realistic visual style without regard to other display styles in the screen.
Rendered
Plot objects by rendered visual style without regard to other display styles in the screen.
Quality
Specify the plot pixels of specified color and rendered viewport.
Draft
Plot and set the render and shade model space viewport to be wireframe.
PREVIEW
Plot and set pixels of the render and shade model space viewport to be 1/4 of current pixel, the maximum is 150 DPI.
General
Plot and set pixels of the render and shade model space viewport to be 1/2 of current pixel, the maximum is 300 DPI.
Presentation
Plot and set pixels of the render and shade model space viewport to be current pixel, the maximum is 600 DPI.
Maximum
Plot and set pixels of the render and shade model space viewport to be current pixel without the maximum value.
User define
Plot and set pixels of the render and shade model space viewport to be specified pixel in "DPI" box. The maximum value is the current pixel.
DPI
Specify the number of point per inch when rendering and shading view. The maximum value is the largest pixels of current plot equipment. This option is available when selected "User define" option in "Quality".
Plot options
Specify some options, such as lineweight, plot style, plot order and so on.
Plot in background
Plot objects in background.(BACKGROUNDPLOT system variable)
Plot object lineweight
Specify whether to plot the lineweight of specified objects and layers. If selected "Plot with plot style" option, this option will not be available.
Plot with plot style
Specify whether to plot the applied plot style of objects and layers. If selected this option, the "Plot object lineweight" option will be selected automatically.
Plot paper space
It usually plots objects in paper space, and then plot objects in model space.
Hide paperspace
Specify whether to apply HIDE on objects in viewport in layout. This option is only available in layout. Users could see the effect of this settings in preview rather than layout.
Plot stamp on
Turn on the Plot stamp on function. It will place a plot stamp at specified corner point and record to file.
Save changes to layout
Save changes in plot dialog box to layout.
Drawing orientation
Specify the drawing orientation for plotter which supports plot in portrait or landscape. The drawing icon represents the media orientation of selected drawing. The letter icon represents the direction of graphics in drawing.
Portrait
Place and plot a drawing. The short side of drawing is on the top of drawing page.
Landscape
Place and plot a drawing. The long side of drawing is on the top of drawing page.
Plot upside-down
Place and plot a drawing in upside-down orientation.
Icon
Specify the media orientation of selected drawing. Using the letter to specify the drawing orientation of page. Note: the drawing orientation is also affected by PLOTROTMODE system variable.
Less options
Hide the following options in plot dialog box:
Plot style table
Shaded viewport options
Plot options
Drawing orientation.